Zip Codes with the Highest Percentage of Population with a Degree in Communications in Chicago, IL
RELATED REPORTS & OPTIONS
Communications
Chicago
Compare Zip Codes
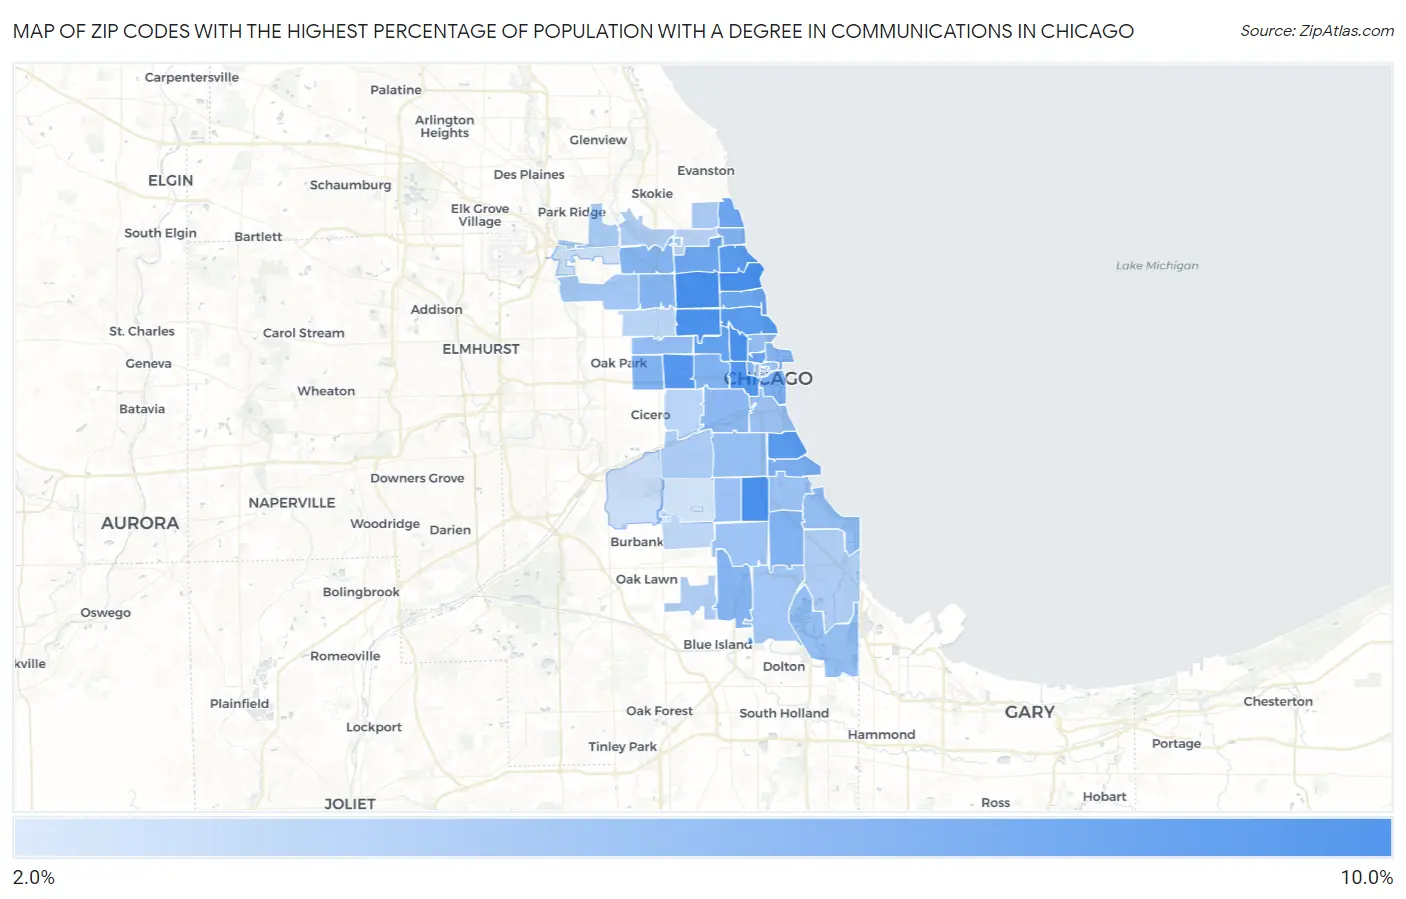
Map of Zip Codes with the Highest Percentage of Population with a Degree in Communications in Chicago
2.0%
9.5%
Zip Codes with the Highest Percentage of Population with a Degree in Communications in Chicago, IL
| Zip Code | % Graduates | vs State | vs National | |
| 1. | 60613 | 9.5% | 5.1%(+4.40)#77 | 4.1%(+5.37)#1,266 |
| 2. | 60618 | 9.5% | 5.1%(+4.38)#78 | 4.1%(+5.35)#1,275 |
| 3. | 60642 | 9.4% | 5.1%(+4.28)#80 | 4.1%(+5.25)#1,302 |
| 4. | 60621 | 9.3% | 5.1%(+4.23)#83 | 4.1%(+5.20)#1,317 |
| 5. | 60647 | 9.3% | 5.1%(+4.21)#86 | 4.1%(+5.18)#1,325 |
| 6. | 60607 | 9.0% | 5.1%(+3.85)#88 | 4.1%(+4.82)#1,451 |
| 7. | 60624 | 8.8% | 5.1%(+3.72)#96 | 4.1%(+4.69)#1,498 |
| 8. | 60653 | 8.7% | 5.1%(+3.61)#98 | 4.1%(+4.58)#1,540 |
| 9. | 60640 | 8.7% | 5.1%(+3.60)#99 | 4.1%(+4.57)#1,546 |
| 10. | 60614 | 8.6% | 5.1%(+3.51)#102 | 4.1%(+4.48)#1,583 |
| 11. | 60622 | 8.1% | 5.1%(+2.99)#116 | 4.1%(+3.96)#1,829 |
| 12. | 60654 | 7.9% | 5.1%(+2.83)#119 | 4.1%(+3.80)#1,918 |
| 13. | 60626 | 7.7% | 5.1%(+2.55)#138 | 4.1%(+3.52)#2,095 |
| 14. | 60657 | 7.5% | 5.1%(+2.44)#140 | 4.1%(+3.41)#2,165 |
| 15. | 60625 | 7.5% | 5.1%(+2.42)#144 | 4.1%(+3.39)#2,172 |
| 16. | 60615 | 6.8% | 5.1%(+1.73)#172 | 4.1%(+2.70)#2,755 |
| 17. | 60605 | 6.8% | 5.1%(+1.67)#176 | 4.1%(+2.64)#2,816 |
| 18. | 60612 | 6.6% | 5.1%(+1.49)#187 | 4.1%(+2.46)#3,027 |
| 19. | 60619 | 6.6% | 5.1%(+1.48)#188 | 4.1%(+2.45)#3,037 |
| 20. | 60644 | 6.5% | 5.1%(+1.44)#192 | 4.1%(+2.41)#3,086 |
| 21. | 60660 | 6.4% | 5.1%(+1.32)#202 | 4.1%(+2.29)#3,216 |
| 22. | 60661 | 6.4% | 5.1%(+1.26)#209 | 4.1%(+2.23)#3,290 |
| 23. | 60643 | 6.3% | 5.1%(+1.22)#213 | 4.1%(+2.19)#3,337 |
| 24. | 60641 | 6.3% | 5.1%(+1.19)#215 | 4.1%(+2.16)#3,363 |
| 25. | 60630 | 6.3% | 5.1%(+1.18)#217 | 4.1%(+2.15)#3,379 |
| 26. | 60611 | 6.3% | 5.1%(+1.17)#220 | 4.1%(+2.14)#3,397 |
| 27. | 60602 | 6.2% | 5.1%(+1.05)#226 | 4.1%(+2.02)#3,548 |
| 28. | 60608 | 6.0% | 5.1%(+0.880)#238 | 4.1%(+1.85)#3,802 |
| 29. | 60610 | 5.6% | 5.1%(+0.523)#278 | 4.1%(+1.49)#4,398 |
| 30. | 60651 | 5.6% | 5.1%(+0.495)#280 | 4.1%(+1.46)#4,455 |
| 31. | 60609 | 5.5% | 5.1%(+0.426)#288 | 4.1%(+1.40)#4,591 |
| 32. | 60633 | 5.5% | 5.1%(+0.417)#290 | 4.1%(+1.39)#4,606 |
| 33. | 60649 | 5.5% | 5.1%(+0.363)#295 | 4.1%(+1.33)#4,703 |
| 34. | 60636 | 5.3% | 5.1%(+0.213)#312 | 4.1%(+1.18)#5,002 |
| 35. | 60616 | 5.3% | 5.1%(+0.163)#317 | 4.1%(+1.13)#5,098 |
| 36. | 60637 | 5.3% | 5.1%(+0.151)#320 | 4.1%(+1.12)#5,132 |
| 37. | 60601 | 5.2% | 5.1%(+0.066)#327 | 4.1%(+1.04)#5,313 |
| 38. | 60620 | 5.1% | 5.1%(-0.042)#339 | 4.1%(+0.928)#5,548 |
| 39. | 60634 | 4.9% | 5.1%(-0.243)#364 | 4.1%(+0.727)#6,028 |
| 40. | 60628 | 4.9% | 5.1%(-0.249)#365 | 4.1%(+0.721)#6,053 |
| 41. | 60606 | 4.7% | 5.1%(-0.447)#383 | 4.1%(+0.522)#6,526 |
| 42. | 60631 | 4.6% | 5.1%(-0.484)#391 | 4.1%(+0.486)#6,632 |
| 43. | 60645 | 4.4% | 5.1%(-0.662)#406 | 4.1%(+0.308)#7,123 |
| 44. | 60632 | 4.4% | 5.1%(-0.752)#418 | 4.1%(+0.217)#7,398 |
| 45. | 60617 | 4.3% | 5.1%(-0.796)#429 | 4.1%(+0.174)#7,559 |
| 46. | 60655 | 4.3% | 5.1%(-0.844)#433 | 4.1%(+0.126)#7,688 |
| 47. | 60604 | 4.3% | 5.1%(-0.850)#434 | 4.1%(+0.120)#7,714 |
| 48. | 60646 | 4.2% | 5.1%(-0.885)#437 | 4.1%(+0.085)#7,837 |
| 49. | 60659 | 3.8% | 5.1%(-1.29)#484 | 4.1%(-0.318)#9,217 |
| 50. | 60639 | 3.7% | 5.1%(-1.37)#488 | 4.1%(-0.400)#9,506 |
| 51. | 60623 | 3.7% | 5.1%(-1.43)#496 | 4.1%(-0.457)#9,704 |
| 52. | 60652 | 3.4% | 5.1%(-1.68)#536 | 4.1%(-0.711)#10,613 |
| 53. | 60638 | 3.0% | 5.1%(-2.14)#601 | 4.1%(-1.17)#12,355 |
| 54. | 60656 | 2.7% | 5.1%(-2.43)#637 | 4.1%(-1.47)#13,524 |
| 55. | 60629 | 2.4% | 5.1%(-2.67)#669 | 4.1%(-1.70)#14,355 |
| 56. | 60603 | 2.0% | 5.1%(-3.09)#714 | 4.1%(-2.12)#15,815 |
1
Common Questions
What are the Top 10 Zip Codes with the Highest Percentage of Population with a Degree in Communications in Chicago, IL?
Top 10 Zip Codes with the Highest Percentage of Population with a Degree in Communications in Chicago, IL are:
What zip code has the Highest Percentage of Population with a Degree in Communications in Chicago, IL?
60613 has the Highest Percentage of Population with a Degree in Communications in Chicago, IL with 9.5%.
What is the Percentage of Population with a Degree in Communications in Chicago, IL?
Percentage of Population with a Degree in Communications in Chicago is 6.9%.
What is the Percentage of Population with a Degree in Communications in Illinois?
Percentage of Population with a Degree in Communications in Illinois is 5.1%.
What is the Percentage of Population with a Degree in Communications in the United States?
Percentage of Population with a Degree in Communications in the United States is 4.1%.