Zip Codes with the Fewest Births per 1,000 Women Over the Age of 35 in Chicago, IL

RELATED REPORTS & OPTIONS

Lowest Birth Rate | Women 35+
Population
Families and Households
Female Fertility
Female Fertility (Unmarried)
Race (Community Size)
Race (Percentage)
Ancestry (Community Size)
AfghanAfricanAlbanianAmericanApacheArabArgentineanArmenianAssyrian / Chaldean / SyriacAustralianAustrianBahamianBangladeshiBarbadianBasqueBelgianBelizeanBermudanBhutaneseBlackfeetBolivianBrazilianBritishBritish West IndianBulgarianBurmeseCajunCambodianCanadianCape VerdeanCarpatho RusynCelticCentral AmericanCentral American IndianCherokeeChickasawChileanChippewaChoctawColombianComancheCosta RicanCreeCreekCroatianCubanCypriotCzechCzechoslovakianDanishDominicanDutchEastern EuropeanEcuadorianEgyptianEnglishEstonianEthiopianEuropeanFilipinoFinnishFrenchFrench American IndianFrench CanadianGermanGerman RussianGhanaianGreekGuamanian / ChamorroGuatemalanGuyaneseHaitianHmongHonduranHopiHungarianIcelanderIndian (Asian)IndonesianInupiatIranianIraqiIrishIroquoisIsraeliItalianJamaicanJapaneseJordanianKenyanKiowaKoreanLaotianLatvianLebaneseLiberianLithuanianLumbeeLuxembourgerMacedonianMalaysianMalteseMenomineeMexicanMexican American IndianMongolianMoroccanNative HawaiianNavajoNew ZealanderNicaraguanNigerianNorthern EuropeanNorwegianOkinawanOsageOttawaPaiutePakistaniPalestinianPanamanianParaguayanPennsylvania GermanPeruvianPolishPortuguesePotawatomiPuebloPuerto RicanPuget Sound SalishRomanianRussianSalvadoranSamoanScandinavianScotch-IrishScottishSeminoleSenegaleseSerbianShoshoneSierra LeoneanSiouxSlavicSlovakSloveneSomaliSouth AfricanSouth AmericanSouth American IndianSoviet UnionSpaniardSpanishSpanish AmericanSri LankanSubsaharan AfricanSudaneseSwedishSwissSyrianTaiwaneseThaiTonganTrinidadian and TobagonianTurkishU.S. Virgin IslanderUgandanUkrainianUruguayanVenezuelanVietnameseWelshWest IndianYaquiYugoslavianZimbabwean
Ancestry (Percentage)
AfghanAfricanAlbanianAmericanApacheArabArgentineanArmenianAssyrian / Chaldean / SyriacAustralianAustrianBahamianBangladeshiBarbadianBasqueBelgianBelizeanBermudanBhutaneseBlackfeetBolivianBrazilianBritishBritish West IndianBulgarianBurmeseCajunCambodianCanadianCape VerdeanCarpatho RusynCelticCentral AmericanCentral American IndianCherokeeChickasawChileanChippewaChoctawColombianComancheCosta RicanCreeCreekCroatianCubanCypriotCzechCzechoslovakianDanishDominicanDutchEastern EuropeanEcuadorianEgyptianEnglishEstonianEthiopianEuropeanFilipinoFinnishFrenchFrench American IndianFrench CanadianGermanGerman RussianGhanaianGreekGuamanian / ChamorroGuatemalanGuyaneseHaitianHmongHonduranHopiHungarianIcelanderIndian (Asian)IndonesianInupiatIranianIraqiIrishIroquoisIsraeliItalianJamaicanJapaneseJordanianKenyanKiowaKoreanLaotianLatvianLebaneseLiberianLithuanianLumbeeLuxembourgerMacedonianMalaysianMalteseMenomineeMexicanMexican American IndianMongolianMoroccanNative HawaiianNavajoNew ZealanderNicaraguanNigerianNorthern EuropeanNorwegianOkinawanOsageOttawaPaiutePakistaniPalestinianPanamanianParaguayanPennsylvania GermanPeruvianPolishPortuguesePotawatomiPuebloPuerto RicanPuget Sound SalishRomanianRussianSalvadoranSamoanScandinavianScotch-IrishScottishSeminoleSenegaleseSerbianShoshoneSierra LeoneanSiouxSlavicSlovakSloveneSomaliSouth AfricanSouth AmericanSouth American IndianSoviet UnionSpaniardSpanishSpanish AmericanSri LankanSubsaharan AfricanSudaneseSwedishSwissSyrianTaiwaneseThaiTonganTrinidadian and TobagonianTurkishU.S. Virgin IslanderUgandanUkrainianUruguayanVenezuelanVietnameseWelshWest IndianYaquiYugoslavianZimbabwean
Immigrant Origin (Total)
AfghanistanAfricaAlbaniaArgentinaArmeniaAsiaAustraliaAustriaBahamasBangladeshBarbadosBelarusBelgiumBelizeBoliviaBosnia and HerzegovinaBrazilBulgariaBurma / MyanmarCambodiaCameroonCanadaCaribbeanCentral AmericaChileChinaColombiaCongoCosta RicaCroatiaCubaCzechoslovakiaDenmarkDominicaDominican RepublicEastern AfricaEastern AsiaEastern EuropeEcuadorEgyptEl SalvadorEnglandEritreaEthiopiaEuropeFijiFranceGermanyGhanaGreeceGuatemalaGuyanaHaitiHondurasHong KongHungaryIndiaIndonesiaIranIraqIrelandIsraelItalyJamaicaJapanJordanKazakhstanKenyaKoreaKuwaitLaosLatin AmericaLatviaLebanonLiberiaLithuaniaMalaysiaMexicoMiddle AfricaMoldovaMoroccoNepalNetherlandsNicaraguaNigeriaNorth MacedoniaNorthern AfricaNorthern EuropeNorwayOceaniaPakistanPanamaPeruPhilippinesPolandPortugalRomaniaRussiaSaudi ArabiaScotlandSenegalSerbiaSierra LeoneSingaporeSomaliaSouth AfricaSouth AmericaSouth Central AsiaSouth Eastern AsiaSouthern EuropeSpainSri LankaSudanSwedenSwitzerlandSyriaTaiwanThailandTrinidad and TobagoTurkeyUgandaUkraineUruguayUzbekistanVenezuelaVietnamWest IndiesWestern AfricaWestern AsiaWestern EuropeYemenZaireZimbabwe
Immigrant Origin (Percentage)
AfghanistanAfricaAlbaniaArgentinaArmeniaAsiaAustraliaAustriaBahamasBangladeshBarbadosBelarusBelgiumBelizeBoliviaBosnia and HerzegovinaBrazilBulgariaBurma / MyanmarCambodiaCameroonCanadaCaribbeanCentral AmericaChileChinaColombiaCongoCosta RicaCroatiaCubaCzechoslovakiaDenmarkDominicaDominican RepublicEastern AfricaEastern AsiaEastern EuropeEcuadorEgyptEl SalvadorEnglandEritreaEthiopiaEuropeFijiFranceGermanyGhanaGreeceGuatemalaGuyanaHaitiHondurasHong KongHungaryIndiaIndonesiaIranIraqIrelandIsraelItalyJamaicaJapanJordanKazakhstanKenyaKoreaKuwaitLaosLatin AmericaLatviaLebanonLiberiaLithuaniaMalaysiaMexicoMiddle AfricaMoldovaMoroccoNepalNetherlandsNicaraguaNigeriaNorth MacedoniaNorthern AfricaNorthern EuropeNorwayOceaniaPakistanPanamaPeruPhilippinesPolandPortugalRomaniaRussiaSaudi ArabiaScotlandSenegalSerbiaSierra LeoneSingaporeSomaliaSouth AfricaSouth AmericaSouth Central AsiaSouth Eastern AsiaSouthern EuropeSpainSri LankaSudanSwedenSwitzerlandSyriaTaiwanThailandTrinidad and TobagoTurkeyUgandaUkraineUruguayUzbekistanVenezuelaVietnamWest IndiesWestern AfricaWestern AsiaWestern EuropeYemenZaireZimbabwe
Income
Income (Families)
Income (Households)
Poverty
Poverty (Families)
Unemployment
Employment Occupations
Employment Industries
Employer Class
Commute Time
Commute Means
School Enrollment
Education by Degree Field
Occupancy
Finances
Physical Characteristics
Chicago
Compare Zip Codes
Comparison Subject

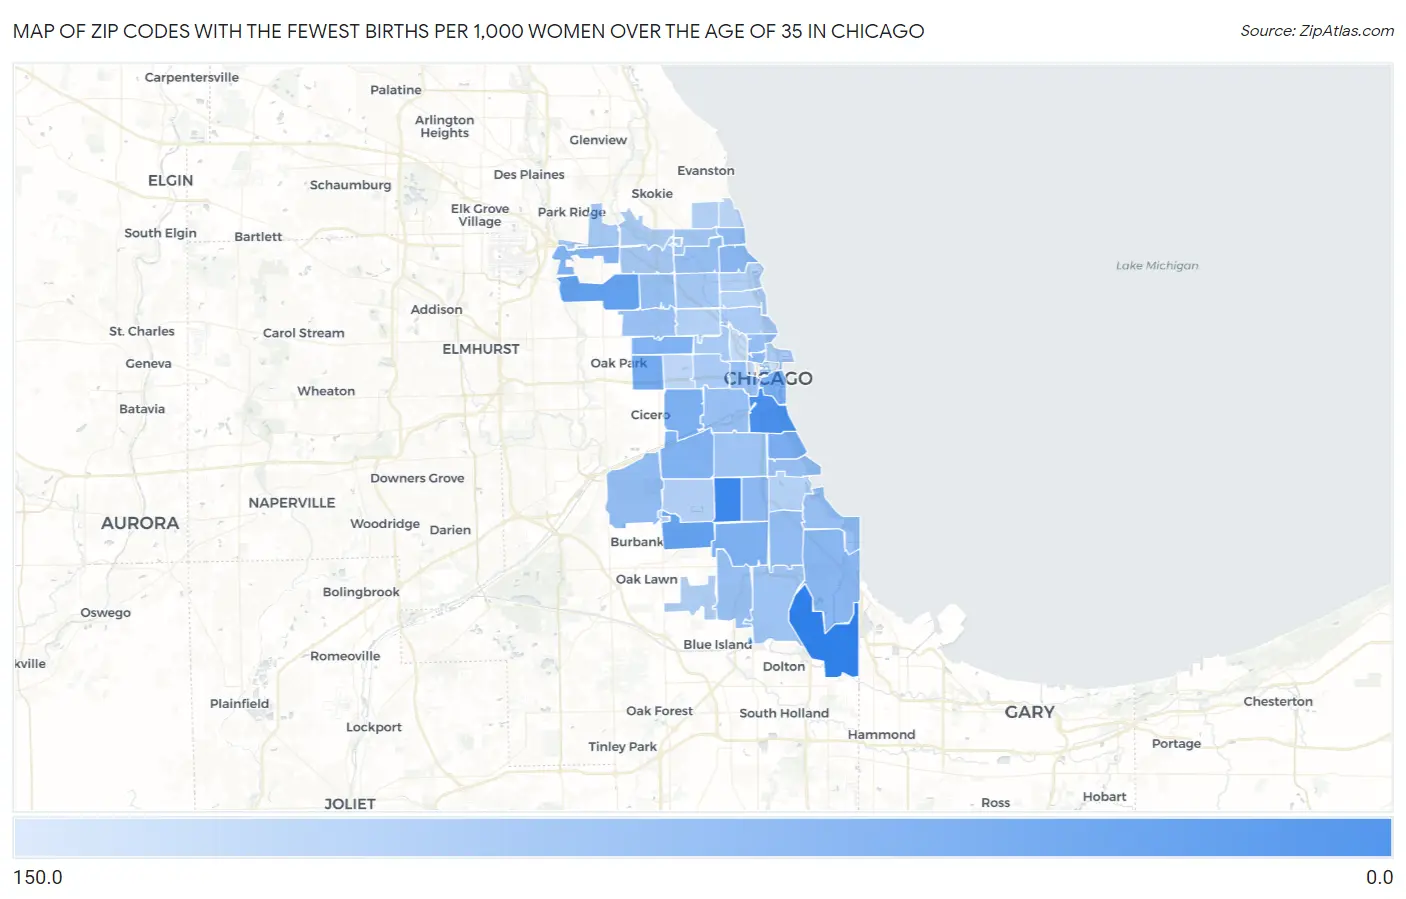
Map of Zip Codes with the Fewest Births per 1,000 Women Over the Age of 35 in Chicago

150.0
0.0
Zip Codes with the Fewest Births per 1,000 Women Over the Age of 35 in Chicago Map

Zip Codes with the Fewest Births per 1,000 Women Over the Age of 35 in Chicago, IL

Zip Code Births / 1,000 Women vs State vs National
1.606366.034.0(-28.0)#2032.0(-26.0)#606
2.606168.034.0(-26.0)#3732.0(-24.0)#1,003
3.6063413.034.0(-21.0)#9532.0(-19.0)#2,399
4.6065213.034.0(-21.0)#9632.0(-19.0)#2,419
5.6064419.034.0(-15.0)#16832.0(-13.0)#4,230
6.6065320.034.0(-14.0)#17932.0(-12.0)#4,563
7.6060520.034.0(-14.0)#18032.0(-12.0)#4,565
8.6062321.034.0(-13.0)#19832.0(-11.0)#4,822
9.6062022.034.0(-12.0)#20832.0(-10.00)#5,155
10.6063223.034.0(-11.0)#22332.0(-9.00)#5,452
11.6065123.034.0(-11.0)#22432.0(-9.00)#5,455
12.6065625.034.0(-9.00)#24532.0(-7.00)#6,153
13.6061728.034.0(-6.00)#27832.0(-4.00)#7,010
14.6064028.034.0(-6.00)#27932.0(-4.00)#7,014
15.6065428.034.0(-6.00)#28532.0(-4.00)#7,131
16.6062129.034.0(-5.00)#28932.0(-3.00)#7,385
17.6066032.034.0(-2.00)#31932.0(=0.000)#8,179
18.6061933.034.0(-1.000)#33132.0(+1.000)#8,434
19.6063833.034.0(-1.000)#33332.0(+1.000)#8,439
20.6064134.034.0(=0.000)#34532.0(+2.00)#8,716
21.6060835.034.0(+1.000)#35932.0(+3.00)#8,998
22.6064935.034.0(+1.000)#36132.0(+3.00)#9,029
23.6064335.034.0(+1.000)#36232.0(+3.00)#9,035
24.6061535.034.0(+1.000)#36332.0(+3.00)#9,047
25.6060735.034.0(+1.000)#36632.0(+3.00)#9,091
26.6062536.034.0(+2.00)#37732.0(+4.00)#9,247
27.6061036.034.0(+2.00)#37832.0(+4.00)#9,282
28.6063937.034.0(+3.00)#38832.0(+5.00)#9,482
29.6062840.034.0(+6.00)#41632.0(+8.00)#10,128
30.6060941.034.0(+7.00)#42332.0(+9.00)#10,351
31.6065944.034.0(+10.00)#44332.0(+12.0)#11,033
32.6061846.034.0(+12.0)#45732.0(+14.0)#11,375
33.6063046.034.0(+12.0)#45832.0(+14.0)#11,394
34.6063146.034.0(+12.0)#46132.0(+14.0)#11,428
35.6062248.034.0(+14.0)#47032.0(+16.0)#11,697
36.6061449.034.0(+15.0)#48532.0(+17.0)#11,859
37.6061151.034.0(+17.0)#49732.0(+19.0)#12,214
38.6061251.034.0(+17.0)#49832.0(+19.0)#12,218
39.6064652.034.0(+18.0)#50432.0(+20.0)#12,358
40.6065555.034.0(+21.0)#52432.0(+23.0)#12,731
41.6061357.034.0(+23.0)#53032.0(+25.0)#12,946
42.6062958.034.0(+24.0)#53632.0(+26.0)#13,057
43.6064561.034.0(+27.0)#55032.0(+29.0)#13,375
44.6063762.034.0(+28.0)#55632.0(+30.0)#13,474
45.6064763.034.0(+29.0)#56232.0(+31.0)#13,560
46.6065763.034.0(+29.0)#56332.0(+31.0)#13,561
47.6062667.034.0(+33.0)#57332.0(+35.0)#13,923
48.6062469.034.0(+35.0)#58132.0(+37.0)#14,098
49.6066173.034.0(+39.0)#59432.0(+41.0)#14,372
50.6064280.034.0(+46.0)#61132.0(+48.0)#14,754
51.6060194.034.0(+60.0)#63432.0(+62.0)#15,280
52.60603102.034.0(+68.0)#64632.0(+70.0)#15,517

Common Questions

What are the Top 10 Zip Codes with the Fewest Births per 1,000 Women Over the Age of 35 in Chicago, IL?
Top 10 Zip Codes with the Fewest Births per 1,000 Women Over the Age of 35 in Chicago, IL are:
#1
0.0
#2
6.0
#3
8.0
#4
13.0
#5
13.0
#6
19.0
#7
20.0
#8
20.0
#9
21.0
#10
22.0
What zip code has the Fewest Births per 1,000 Women Over the Age of 35 in Chicago, IL?
60636 has the Fewest Births per 1,000 Women Over the Age of 35 in Chicago, IL with 6.0.
What is the Number of Births per 1,000 Women Over the Age of 35 in Chicago, IL?
Number of Births per 1,000 Women Over the Age of 35 in Chicago is 38.0.
What is the Number of Births per 1,000 Women Over the Age of 35 in Illinois?
Number of Births per 1,000 Women Over the Age of 35 in Illinois is 34.0.
What is the Number of Births per 1,000 Women Over the Age of 35 in the United States?
Number of Births per 1,000 Women Over the Age of 35 in the United States is 32.0.