Zip Codes with the Highest Percentage of Population with a Degree in Visual and Performing Arts in Chicago, IL
RELATED REPORTS & OPTIONS
Visual and Performing Arts
Chicago
Compare Zip Codes
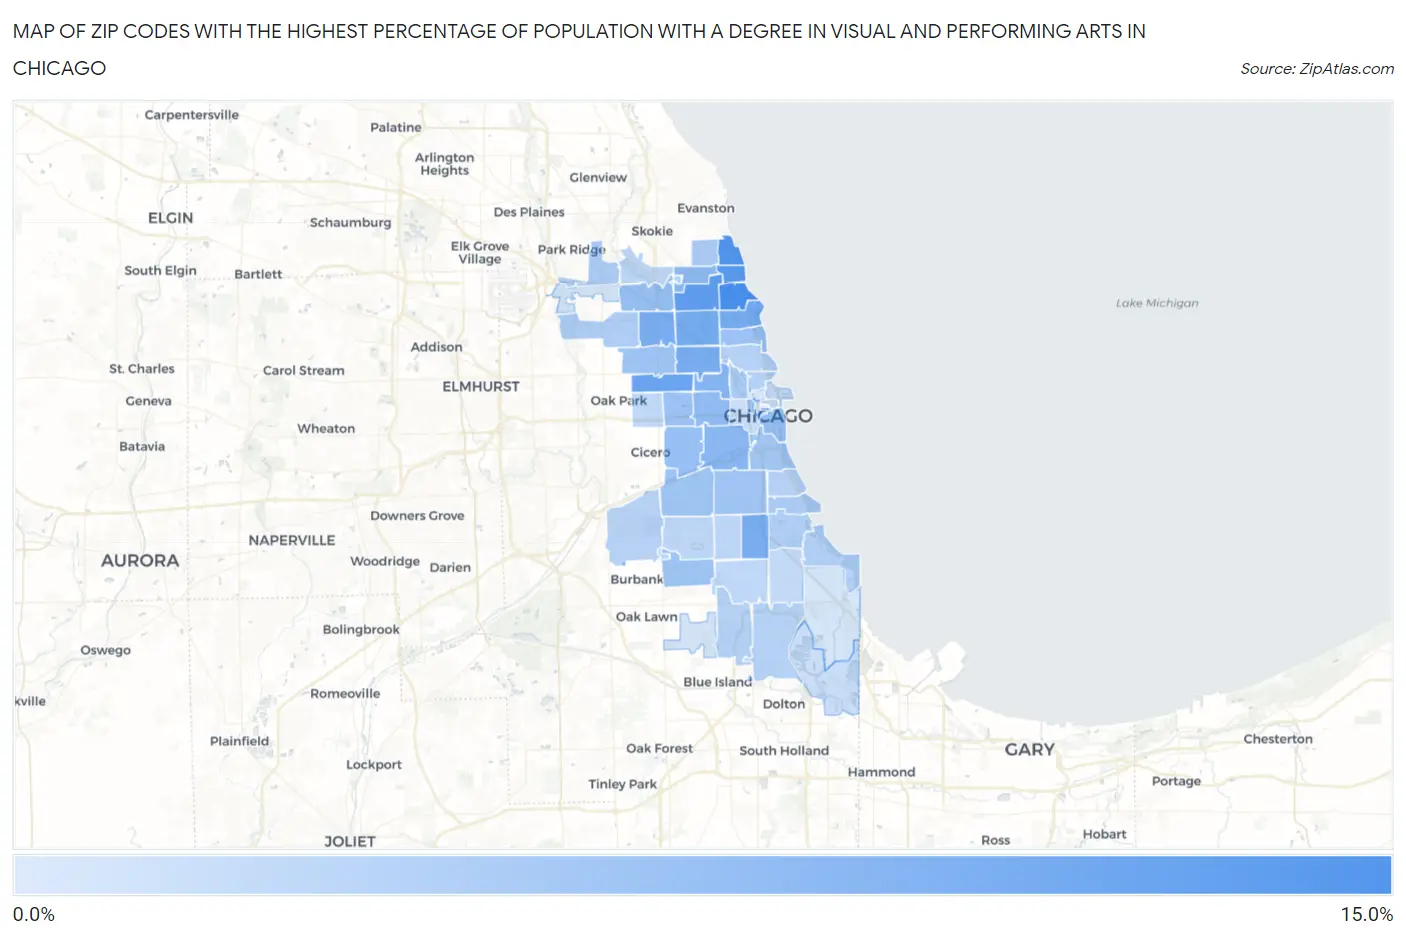
Map of Zip Codes with the Highest Percentage of Population with a Degree in Visual and Performing Arts in Chicago
1.2%
13.9%
Zip Codes with the Highest Percentage of Population with a Degree in Visual and Performing Arts in Chicago, IL
| Zip Code | % Graduates | vs State | vs National | |
| 1. | 60640 | 13.9% | 4.4%(+9.44)#39 | 4.3%(+9.64)#969 |
| 2. | 60626 | 13.3% | 4.4%(+8.89)#41 | 4.3%(+9.09)#1,038 |
| 3. | 60660 | 12.4% | 4.4%(+7.94)#47 | 4.3%(+8.14)#1,211 |
| 4. | 60625 | 11.7% | 4.4%(+7.24)#53 | 4.3%(+7.44)#1,354 |
| 5. | 60603 | 11.4% | 4.4%(+6.94)#55 | 4.3%(+7.14)#1,417 |
| 6. | 60651 | 10.8% | 4.4%(+6.35)#59 | 4.3%(+6.55)#1,589 |
| 7. | 60613 | 9.9% | 4.4%(+5.47)#68 | 4.3%(+5.67)#1,864 |
| 8. | 60618 | 9.8% | 4.4%(+5.39)#69 | 4.3%(+5.58)#1,896 |
| 9. | 60647 | 9.7% | 4.4%(+5.21)#72 | 4.3%(+5.41)#1,960 |
| 10. | 60641 | 9.4% | 4.4%(+4.93)#75 | 4.3%(+5.13)#2,069 |
| 11. | 60621 | 9.3% | 4.4%(+4.89)#76 | 4.3%(+5.09)#2,086 |
| 12. | 60622 | 8.4% | 4.4%(+3.93)#97 | 4.3%(+4.12)#2,609 |
| 13. | 60608 | 8.1% | 4.4%(+3.62)#108 | 4.3%(+3.82)#2,798 |
| 14. | 60659 | 7.6% | 4.4%(+3.19)#119 | 4.3%(+3.39)#3,111 |
| 15. | 60612 | 7.5% | 4.4%(+3.04)#122 | 4.3%(+3.24)#3,215 |
| 16. | 60605 | 7.0% | 4.4%(+2.54)#140 | 4.3%(+2.74)#3,671 |
| 17. | 60630 | 6.9% | 4.4%(+2.46)#144 | 4.3%(+2.66)#3,744 |
| 18. | 60623 | 6.8% | 4.4%(+2.34)#152 | 4.3%(+2.54)#3,883 |
| 19. | 60624 | 6.8% | 4.4%(+2.33)#153 | 4.3%(+2.53)#3,891 |
| 20. | 60657 | 6.6% | 4.4%(+2.15)#165 | 4.3%(+2.35)#4,110 |
| 21. | 60639 | 6.4% | 4.4%(+1.92)#177 | 4.3%(+2.11)#4,380 |
| 22. | 60661 | 6.4% | 4.4%(+1.91)#178 | 4.3%(+2.11)#4,391 |
| 23. | 60652 | 6.3% | 4.4%(+1.88)#181 | 4.3%(+2.08)#4,434 |
| 24. | 60632 | 6.3% | 4.4%(+1.88)#182 | 4.3%(+2.08)#4,435 |
| 25. | 60609 | 6.1% | 4.4%(+1.64)#193 | 4.3%(+1.84)#4,745 |
| 26. | 60616 | 5.9% | 4.4%(+1.43)#202 | 4.3%(+1.63)#5,043 |
| 27. | 60645 | 5.4% | 4.4%(+0.942)#222 | 4.3%(+1.14)#5,875 |
| 28. | 60642 | 5.2% | 4.4%(+0.764)#231 | 4.3%(+0.962)#6,214 |
| 29. | 60631 | 5.2% | 4.4%(+0.741)#234 | 4.3%(+0.939)#6,257 |
| 30. | 60615 | 5.1% | 4.4%(+0.657)#238 | 4.3%(+0.854)#6,409 |
| 31. | 60634 | 4.9% | 4.4%(+0.459)#253 | 4.3%(+0.657)#6,845 |
| 32. | 60637 | 4.8% | 4.4%(+0.324)#270 | 4.3%(+0.522)#7,127 |
| 33. | 60649 | 4.5% | 4.4%(+0.099)#299 | 4.3%(+0.297)#7,667 |
| 34. | 60643 | 4.5% | 4.4%(+0.001)#310 | 4.3%(+0.199)#7,938 |
| 35. | 60610 | 4.4% | 4.4%(-0.091)#320 | 4.3%(+0.106)#8,195 |
| 36. | 60614 | 4.3% | 4.4%(-0.146)#325 | 4.3%(+0.052)#8,344 |
| 37. | 60628 | 4.3% | 4.4%(-0.146)#326 | 4.3%(+0.052)#8,345 |
| 38. | 60653 | 4.2% | 4.4%(-0.280)#344 | 4.3%(-0.082)#8,716 |
| 39. | 60638 | 4.1% | 4.4%(-0.318)#350 | 4.3%(-0.120)#8,831 |
| 40. | 60636 | 3.9% | 4.4%(-0.540)#374 | 4.3%(-0.342)#9,544 |
| 41. | 60601 | 3.8% | 4.4%(-0.673)#396 | 4.3%(-0.476)#9,919 |
| 42. | 60611 | 3.7% | 4.4%(-0.700)#397 | 4.3%(-0.502)#10,007 |
| 43. | 60629 | 3.7% | 4.4%(-0.733)#401 | 4.3%(-0.535)#10,104 |
| 44. | 60646 | 3.7% | 4.4%(-0.734)#402 | 4.3%(-0.536)#10,107 |
| 45. | 60620 | 3.7% | 4.4%(-0.738)#403 | 4.3%(-0.540)#10,123 |
| 46. | 60644 | 3.5% | 4.4%(-0.952)#437 | 4.3%(-0.754)#10,884 |
| 47. | 60619 | 3.3% | 4.4%(-1.13)#465 | 4.3%(-0.936)#11,541 |
| 48. | 60602 | 3.2% | 4.4%(-1.26)#486 | 4.3%(-1.06)#12,029 |
| 49. | 60607 | 2.8% | 4.4%(-1.68)#558 | 4.3%(-1.48)#13,595 |
| 50. | 60633 | 2.7% | 4.4%(-1.79)#576 | 4.3%(-1.59)#14,067 |
| 51. | 60656 | 1.9% | 4.4%(-2.59)#680 | 4.3%(-2.39)#16,912 |
| 52. | 60617 | 1.8% | 4.4%(-2.63)#687 | 4.3%(-2.43)#17,074 |
| 53. | 60655 | 1.8% | 4.4%(-2.64)#690 | 4.3%(-2.44)#17,104 |
| 54. | 60654 | 1.4% | 4.4%(-3.04)#743 | 4.3%(-2.84)#18,420 |
| 55. | 60606 | 1.3% | 4.4%(-3.13)#751 | 4.3%(-2.94)#18,705 |
| 56. | 60604 | 1.2% | 4.4%(-3.23)#769 | 4.3%(-3.04)#19,025 |
1
Common Questions
What are the Top 10 Zip Codes with the Highest Percentage of Population with a Degree in Visual and Performing Arts in Chicago, IL?
Top 10 Zip Codes with the Highest Percentage of Population with a Degree in Visual and Performing Arts in Chicago, IL are:
What zip code has the Highest Percentage of Population with a Degree in Visual and Performing Arts in Chicago, IL?
60640 has the Highest Percentage of Population with a Degree in Visual and Performing Arts in Chicago, IL with 13.9%.
What is the Percentage of Population with a Degree in Visual and Performing Arts in Chicago, IL?
Percentage of Population with a Degree in Visual and Performing Arts in Chicago is 6.8%.
What is the Percentage of Population with a Degree in Visual and Performing Arts in Illinois?
Percentage of Population with a Degree in Visual and Performing Arts in Illinois is 4.4%.
What is the Percentage of Population with a Degree in Visual and Performing Arts in the United States?
Percentage of Population with a Degree in Visual and Performing Arts in the United States is 4.3%.