Zip Codes with the Highest Percentage of Population Employed in Firefighting & Prevention in Chicago, IL

RELATED REPORTS & OPTIONS

Firefighting & Prevention
Population
Families and Households
Female Fertility
Female Fertility (Unmarried)
Race (Community Size)
Race (Percentage)
Ancestry (Community Size)
AfghanAfricanAlbanianAmericanApacheArabArgentineanArmenianAssyrian / Chaldean / SyriacAustralianAustrianBahamianBangladeshiBarbadianBasqueBelgianBelizeanBermudanBhutaneseBlackfeetBolivianBrazilianBritishBritish West IndianBulgarianBurmeseCajunCambodianCanadianCape VerdeanCarpatho RusynCelticCentral AmericanCentral American IndianCherokeeChickasawChileanChippewaChoctawColombianComancheCosta RicanCreeCreekCroatianCubanCypriotCzechCzechoslovakianDanishDominicanDutchEastern EuropeanEcuadorianEgyptianEnglishEstonianEthiopianEuropeanFilipinoFinnishFrenchFrench American IndianFrench CanadianGermanGerman RussianGhanaianGreekGuamanian / ChamorroGuatemalanGuyaneseHaitianHmongHonduranHopiHungarianIcelanderIndian (Asian)IndonesianInupiatIranianIraqiIrishIroquoisIsraeliItalianJamaicanJapaneseJordanianKenyanKiowaKoreanLaotianLatvianLebaneseLiberianLithuanianLumbeeLuxembourgerMacedonianMalaysianMalteseMenomineeMexicanMexican American IndianMongolianMoroccanNative HawaiianNavajoNew ZealanderNicaraguanNigerianNorthern EuropeanNorwegianOkinawanOsageOttawaPaiutePakistaniPalestinianPanamanianParaguayanPennsylvania GermanPeruvianPolishPortuguesePotawatomiPuebloPuerto RicanPuget Sound SalishRomanianRussianSalvadoranSamoanScandinavianScotch-IrishScottishSeminoleSenegaleseSerbianShoshoneSierra LeoneanSiouxSlavicSlovakSloveneSomaliSouth AfricanSouth AmericanSouth American IndianSoviet UnionSpaniardSpanishSpanish AmericanSri LankanSubsaharan AfricanSudaneseSwedishSwissSyrianTaiwaneseThaiTonganTrinidadian and TobagonianTurkishU.S. Virgin IslanderUgandanUkrainianUruguayanVenezuelanVietnameseWelshWest IndianYaquiYugoslavianZimbabwean
Ancestry (Percentage)
AfghanAfricanAlbanianAmericanApacheArabArgentineanArmenianAssyrian / Chaldean / SyriacAustralianAustrianBahamianBangladeshiBarbadianBasqueBelgianBelizeanBermudanBhutaneseBlackfeetBolivianBrazilianBritishBritish West IndianBulgarianBurmeseCajunCambodianCanadianCape VerdeanCarpatho RusynCelticCentral AmericanCentral American IndianCherokeeChickasawChileanChippewaChoctawColombianComancheCosta RicanCreeCreekCroatianCubanCypriotCzechCzechoslovakianDanishDominicanDutchEastern EuropeanEcuadorianEgyptianEnglishEstonianEthiopianEuropeanFilipinoFinnishFrenchFrench American IndianFrench CanadianGermanGerman RussianGhanaianGreekGuamanian / ChamorroGuatemalanGuyaneseHaitianHmongHonduranHopiHungarianIcelanderIndian (Asian)IndonesianInupiatIranianIraqiIrishIroquoisIsraeliItalianJamaicanJapaneseJordanianKenyanKiowaKoreanLaotianLatvianLebaneseLiberianLithuanianLumbeeLuxembourgerMacedonianMalaysianMalteseMenomineeMexicanMexican American IndianMongolianMoroccanNative HawaiianNavajoNew ZealanderNicaraguanNigerianNorthern EuropeanNorwegianOkinawanOsageOttawaPaiutePakistaniPalestinianPanamanianParaguayanPennsylvania GermanPeruvianPolishPortuguesePotawatomiPuebloPuerto RicanPuget Sound SalishRomanianRussianSalvadoranSamoanScandinavianScotch-IrishScottishSeminoleSenegaleseSerbianShoshoneSierra LeoneanSiouxSlavicSlovakSloveneSomaliSouth AfricanSouth AmericanSouth American IndianSoviet UnionSpaniardSpanishSpanish AmericanSri LankanSubsaharan AfricanSudaneseSwedishSwissSyrianTaiwaneseThaiTonganTrinidadian and TobagonianTurkishU.S. Virgin IslanderUgandanUkrainianUruguayanVenezuelanVietnameseWelshWest IndianYaquiYugoslavianZimbabwean
Immigrant Origin (Total)
AfghanistanAfricaAlbaniaArgentinaArmeniaAsiaAustraliaAustriaBahamasBangladeshBarbadosBelarusBelgiumBelizeBoliviaBosnia and HerzegovinaBrazilBulgariaBurma / MyanmarCambodiaCameroonCanadaCaribbeanCentral AmericaChileChinaColombiaCongoCosta RicaCroatiaCubaCzechoslovakiaDenmarkDominicaDominican RepublicEastern AfricaEastern AsiaEastern EuropeEcuadorEgyptEl SalvadorEnglandEritreaEthiopiaEuropeFijiFranceGermanyGhanaGreeceGuatemalaGuyanaHaitiHondurasHong KongHungaryIndiaIndonesiaIranIraqIrelandIsraelItalyJamaicaJapanJordanKazakhstanKenyaKoreaKuwaitLaosLatin AmericaLatviaLebanonLiberiaLithuaniaMalaysiaMexicoMiddle AfricaMoldovaMoroccoNepalNetherlandsNicaraguaNigeriaNorth MacedoniaNorthern AfricaNorthern EuropeNorwayOceaniaPakistanPanamaPeruPhilippinesPolandPortugalRomaniaRussiaSaudi ArabiaScotlandSenegalSerbiaSierra LeoneSingaporeSomaliaSouth AfricaSouth AmericaSouth Central AsiaSouth Eastern AsiaSouthern EuropeSpainSri LankaSudanSwedenSwitzerlandSyriaTaiwanThailandTrinidad and TobagoTurkeyUgandaUkraineUruguayUzbekistanVenezuelaVietnamWest IndiesWestern AfricaWestern AsiaWestern EuropeYemenZaireZimbabwe
Immigrant Origin (Percentage)
AfghanistanAfricaAlbaniaArgentinaArmeniaAsiaAustraliaAustriaBahamasBangladeshBarbadosBelarusBelgiumBelizeBoliviaBosnia and HerzegovinaBrazilBulgariaBurma / MyanmarCambodiaCameroonCanadaCaribbeanCentral AmericaChileChinaColombiaCongoCosta RicaCroatiaCubaCzechoslovakiaDenmarkDominicaDominican RepublicEastern AfricaEastern AsiaEastern EuropeEcuadorEgyptEl SalvadorEnglandEritreaEthiopiaEuropeFijiFranceGermanyGhanaGreeceGuatemalaGuyanaHaitiHondurasHong KongHungaryIndiaIndonesiaIranIraqIrelandIsraelItalyJamaicaJapanJordanKazakhstanKenyaKoreaKuwaitLaosLatin AmericaLatviaLebanonLiberiaLithuaniaMalaysiaMexicoMiddle AfricaMoldovaMoroccoNepalNetherlandsNicaraguaNigeriaNorth MacedoniaNorthern AfricaNorthern EuropeNorwayOceaniaPakistanPanamaPeruPhilippinesPolandPortugalRomaniaRussiaSaudi ArabiaScotlandSenegalSerbiaSierra LeoneSingaporeSomaliaSouth AfricaSouth AmericaSouth Central AsiaSouth Eastern AsiaSouthern EuropeSpainSri LankaSudanSwedenSwitzerlandSyriaTaiwanThailandTrinidad and TobagoTurkeyUgandaUkraineUruguayUzbekistanVenezuelaVietnamWest IndiesWestern AfricaWestern AsiaWestern EuropeYemenZaireZimbabwe
Income
Income (Families)
Income (Households)
Poverty
Poverty (Families)
Unemployment
Employment Occupations
Employment Industries
Employer Class
Commute Time
Commute Means
School Enrollment
Education by Degree Field
Occupancy
Finances
Physical Characteristics
Chicago
Compare Zip Codes
Comparison Subject

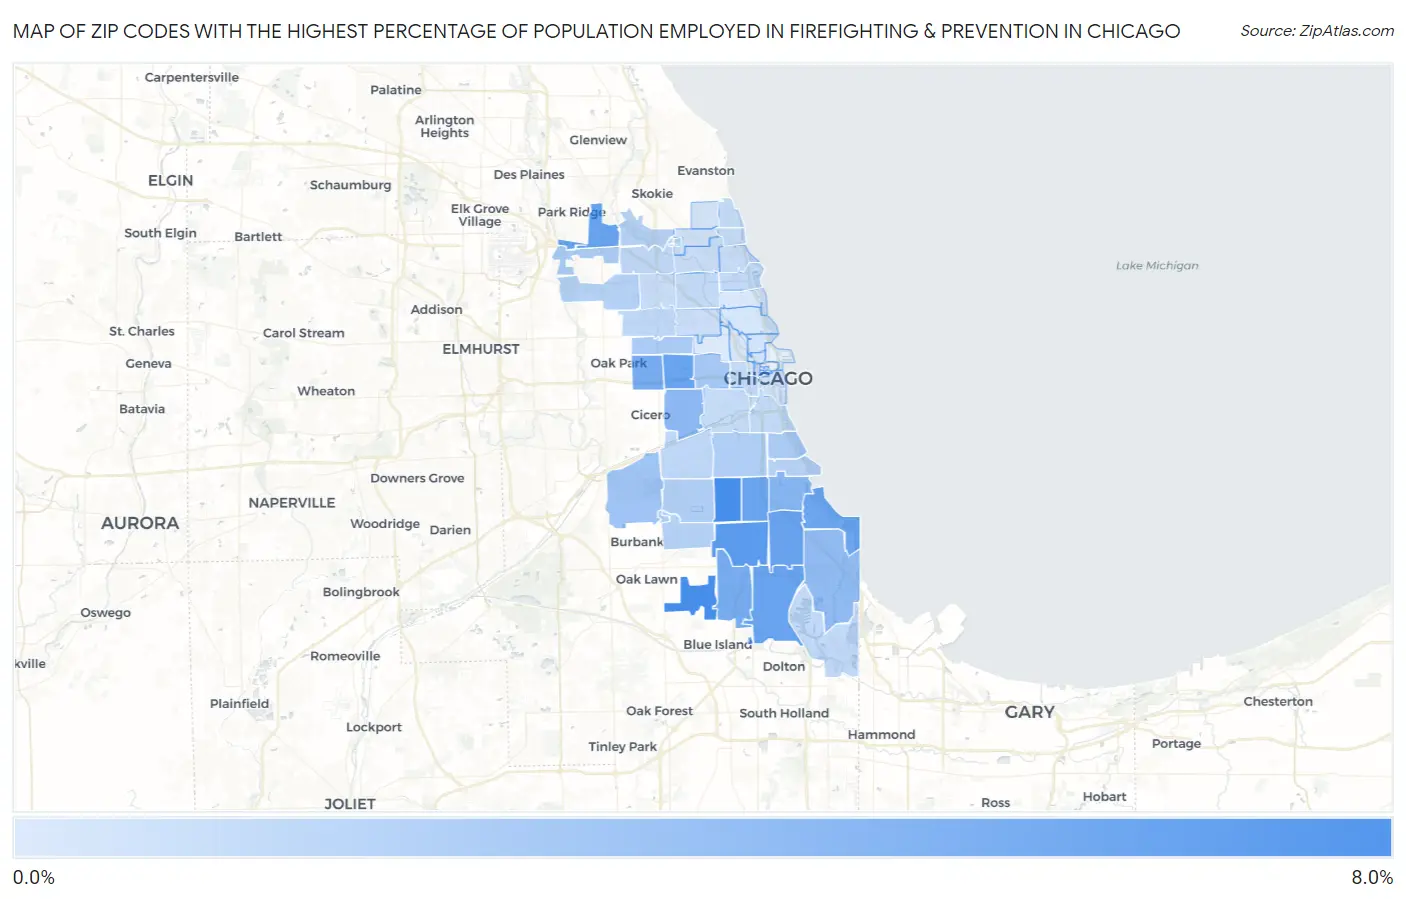
Map of Zip Codes with the Highest Percentage of Population Employed in Firefighting & Prevention in Chicago

0.0%
8.0%
Zip Codes with the Highest Percentage of Population Employed in Firefighting & Prevention in Chicago Map

Zip Codes with the Highest Percentage of Population Employed in Firefighting & Prevention in Chicago, IL

Zip Code % Employed vs State vs National
1.606366.5%1.2%(+5.28)#201.2%(+5.31)#592
2.606556.5%1.2%(+5.26)#211.2%(+5.30)#593
3.606205.6%1.2%(+4.34)#261.2%(+4.38)#755
4.606195.1%1.2%(+3.91)#281.2%(+3.95)#856
5.606245.0%1.2%(+3.73)#321.2%(+3.77)#926
6.606315.0%1.2%(+3.73)#331.2%(+3.77)#927
7.606284.9%1.2%(+3.72)#341.2%(+3.76)#931
8.606214.9%1.2%(+3.67)#351.2%(+3.71)#950
9.606494.7%1.2%(+3.52)#401.2%(+3.55)#1,011
10.606434.4%1.2%(+3.17)#461.2%(+3.21)#1,156
11.606444.4%1.2%(+3.16)#471.2%(+3.20)#1,158
12.606373.7%1.2%(+2.50)#551.2%(+2.54)#1,536
13.606233.5%1.2%(+2.25)#631.2%(+2.29)#1,743
14.606173.3%1.2%(+2.03)#691.2%(+2.07)#1,951
15.606382.6%1.2%(+1.36)#1091.2%(+1.39)#2,938
16.606122.4%1.2%(+1.15)#1261.2%(+1.19)#3,390
17.606512.2%1.2%(+1.01)#1381.2%(+1.05)#3,766
18.606532.1%1.2%(+0.918)#1491.2%(+0.956)#4,028
19.606562.1%1.2%(+0.877)#1541.2%(+0.916)#4,147
20.606292.0%1.2%(+0.734)#1761.2%(+0.772)#4,666
21.606091.9%1.2%(+0.719)#1811.2%(+0.758)#4,723
22.606521.7%1.2%(+0.512)#2121.2%(+0.550)#5,650
23.606341.7%1.2%(+0.456)#2231.2%(+0.495)#5,935
24.606151.6%1.2%(+0.384)#2301.2%(+0.422)#6,333
25.606461.6%1.2%(+0.370)#2361.2%(+0.409)#6,412
26.606391.4%1.2%(+0.152)#3091.2%(+0.190)#7,798
27.606321.3%1.2%(+0.101)#3231.2%(+0.139)#8,153
28.606131.3%1.2%(+0.035)#3431.2%(+0.074)#8,669
29.606301.2%1.2%(+0.001)#3531.2%(+0.039)#8,937
30.606331.2%1.2%(-0.009)#3571.2%(+0.030)#9,016
31.606261.2%1.2%(-0.047)#3691.2%(-0.008)#9,345
32.606601.2%1.2%(-0.064)#3741.2%(-0.025)#9,501
33.606071.1%1.2%(-0.075)#3871.2%(-0.037)#9,630
34.606161.1%1.2%(-0.090)#3931.2%(-0.051)#9,781
35.606181.1%1.2%(-0.132)#4111.2%(-0.093)#10,174
36.606081.0%1.2%(-0.186)#4371.2%(-0.148)#10,702
37.606410.98%1.2%(-0.245)#4711.2%(-0.207)#11,314
38.606400.91%1.2%(-0.318)#5071.2%(-0.280)#12,106
39.606470.88%1.2%(-0.348)#5151.2%(-0.309)#12,399
40.606250.84%1.2%(-0.385)#5381.2%(-0.346)#12,771
41.606590.58%1.2%(-0.643)#6581.2%(-0.604)#15,616
42.606050.57%1.2%(-0.657)#6641.2%(-0.618)#15,764
43.606450.51%1.2%(-0.714)#6941.2%(-0.675)#16,430
44.606540.49%1.2%(-0.737)#7111.2%(-0.698)#16,695
45.606100.49%1.2%(-0.738)#7121.2%(-0.700)#16,714
46.606140.40%1.2%(-0.822)#7451.2%(-0.783)#17,627
47.606060.39%1.2%(-0.833)#7511.2%(-0.795)#17,753
48.606420.26%1.2%(-0.964)#8131.2%(-0.926)#19,154
49.606610.23%1.2%(-0.992)#8241.2%(-0.953)#19,396
50.606570.21%1.2%(-1.01)#8281.2%(-0.972)#19,556
51.606220.081%1.2%(-1.14)#8611.2%(-1.11)#20,390

Common Questions

What are the Top 10 Zip Codes with the Highest Percentage of Population Employed in Firefighting & Prevention in Chicago, IL?
Top 10 Zip Codes with the Highest Percentage of Population Employed in Firefighting & Prevention in Chicago, IL are:
#1
6.5%
#2
6.5%
#3
5.6%
#4
5.1%
#5
5.0%
#6
5.0%
#7
4.9%
#8
4.9%
#9
4.7%
#10
4.4%
What zip code has the Highest Percentage of Population Employed in Firefighting & Prevention in Chicago, IL?
60636 has the Highest Percentage of Population Employed in Firefighting & Prevention in Chicago, IL with 6.5%.
What is the Percentage of Population Employed in Firefighting & Prevention in Chicago, IL?
Percentage of Population Employed in Firefighting & Prevention in Chicago is 1.8%.
What is the Percentage of Population Employed in Firefighting & Prevention in Illinois?
Percentage of Population Employed in Firefighting & Prevention in Illinois is 1.2%.
What is the Percentage of Population Employed in Firefighting & Prevention in the United States?
Percentage of Population Employed in Firefighting & Prevention in the United States is 1.2%.