Zip Codes with the Largest Hungarian Community in Chicago, IL

RELATED REPORTS & OPTIONS

Hungarian
Population
Families and Households
Female Fertility
Female Fertility (Unmarried)
Race (Community Size)
Race (Percentage)
Ancestry (Community Size)
AfghanAfricanAlbanianAmericanApacheArabArgentineanArmenianAssyrian / Chaldean / SyriacAustralianAustrianBahamianBangladeshiBarbadianBasqueBelgianBelizeanBermudanBhutaneseBlackfeetBolivianBrazilianBritishBritish West IndianBulgarianBurmeseCajunCambodianCanadianCape VerdeanCarpatho RusynCelticCentral AmericanCentral American IndianCherokeeChickasawChileanChippewaChoctawColombianComancheCosta RicanCreeCreekCroatianCubanCypriotCzechCzechoslovakianDanishDominicanDutchEastern EuropeanEcuadorianEgyptianEnglishEstonianEthiopianEuropeanFilipinoFinnishFrenchFrench American IndianFrench CanadianGermanGerman RussianGhanaianGreekGuamanian / ChamorroGuatemalanGuyaneseHaitianHmongHonduranHopiHungarianIcelanderIndian (Asian)IndonesianInupiatIranianIraqiIrishIroquoisIsraeliItalianJamaicanJapaneseJordanianKenyanKiowaKoreanLaotianLatvianLebaneseLiberianLithuanianLumbeeLuxembourgerMacedonianMalaysianMalteseMenomineeMexicanMexican American IndianMongolianMoroccanNative HawaiianNavajoNew ZealanderNicaraguanNigerianNorthern EuropeanNorwegianOkinawanOsageOttawaPaiutePakistaniPalestinianPanamanianParaguayanPennsylvania GermanPeruvianPolishPortuguesePotawatomiPuebloPuerto RicanPuget Sound SalishRomanianRussianSalvadoranSamoanScandinavianScotch-IrishScottishSeminoleSenegaleseSerbianShoshoneSierra LeoneanSiouxSlavicSlovakSloveneSomaliSouth AfricanSouth AmericanSouth American IndianSoviet UnionSpaniardSpanishSpanish AmericanSri LankanSubsaharan AfricanSudaneseSwedishSwissSyrianTaiwaneseThaiTonganTrinidadian and TobagonianTurkishU.S. Virgin IslanderUgandanUkrainianUruguayanVenezuelanVietnameseWelshWest IndianYaquiYugoslavianZimbabwean
Ancestry (Percentage)
AfghanAfricanAlbanianAmericanApacheArabArgentineanArmenianAssyrian / Chaldean / SyriacAustralianAustrianBahamianBangladeshiBarbadianBasqueBelgianBelizeanBermudanBhutaneseBlackfeetBolivianBrazilianBritishBritish West IndianBulgarianBurmeseCajunCambodianCanadianCape VerdeanCarpatho RusynCelticCentral AmericanCentral American IndianCherokeeChickasawChileanChippewaChoctawColombianComancheCosta RicanCreeCreekCroatianCubanCypriotCzechCzechoslovakianDanishDominicanDutchEastern EuropeanEcuadorianEgyptianEnglishEstonianEthiopianEuropeanFilipinoFinnishFrenchFrench American IndianFrench CanadianGermanGerman RussianGhanaianGreekGuamanian / ChamorroGuatemalanGuyaneseHaitianHmongHonduranHopiHungarianIcelanderIndian (Asian)IndonesianInupiatIranianIraqiIrishIroquoisIsraeliItalianJamaicanJapaneseJordanianKenyanKiowaKoreanLaotianLatvianLebaneseLiberianLithuanianLumbeeLuxembourgerMacedonianMalaysianMalteseMenomineeMexicanMexican American IndianMongolianMoroccanNative HawaiianNavajoNew ZealanderNicaraguanNigerianNorthern EuropeanNorwegianOkinawanOsageOttawaPaiutePakistaniPalestinianPanamanianParaguayanPennsylvania GermanPeruvianPolishPortuguesePotawatomiPuebloPuerto RicanPuget Sound SalishRomanianRussianSalvadoranSamoanScandinavianScotch-IrishScottishSeminoleSenegaleseSerbianShoshoneSierra LeoneanSiouxSlavicSlovakSloveneSomaliSouth AfricanSouth AmericanSouth American IndianSoviet UnionSpaniardSpanishSpanish AmericanSri LankanSubsaharan AfricanSudaneseSwedishSwissSyrianTaiwaneseThaiTonganTrinidadian and TobagonianTurkishU.S. Virgin IslanderUgandanUkrainianUruguayanVenezuelanVietnameseWelshWest IndianYaquiYugoslavianZimbabwean
Immigrant Origin (Total)
AfghanistanAfricaAlbaniaArgentinaArmeniaAsiaAustraliaAustriaBahamasBangladeshBarbadosBelarusBelgiumBelizeBoliviaBosnia and HerzegovinaBrazilBulgariaBurma / MyanmarCambodiaCameroonCanadaCaribbeanCentral AmericaChileChinaColombiaCongoCosta RicaCroatiaCubaCzechoslovakiaDenmarkDominicaDominican RepublicEastern AfricaEastern AsiaEastern EuropeEcuadorEgyptEl SalvadorEnglandEritreaEthiopiaEuropeFijiFranceGermanyGhanaGreeceGuatemalaGuyanaHaitiHondurasHong KongHungaryIndiaIndonesiaIranIraqIrelandIsraelItalyJamaicaJapanJordanKazakhstanKenyaKoreaKuwaitLaosLatin AmericaLatviaLebanonLiberiaLithuaniaMalaysiaMexicoMiddle AfricaMoldovaMoroccoNepalNetherlandsNicaraguaNigeriaNorth MacedoniaNorthern AfricaNorthern EuropeNorwayOceaniaPakistanPanamaPeruPhilippinesPolandPortugalRomaniaRussiaSaudi ArabiaScotlandSenegalSerbiaSierra LeoneSingaporeSomaliaSouth AfricaSouth AmericaSouth Central AsiaSouth Eastern AsiaSouthern EuropeSpainSri LankaSudanSwedenSwitzerlandSyriaTaiwanThailandTrinidad and TobagoTurkeyUgandaUkraineUruguayUzbekistanVenezuelaVietnamWest IndiesWestern AfricaWestern AsiaWestern EuropeYemenZaireZimbabwe
Immigrant Origin (Percentage)
AfghanistanAfricaAlbaniaArgentinaArmeniaAsiaAustraliaAustriaBahamasBangladeshBarbadosBelarusBelgiumBelizeBoliviaBosnia and HerzegovinaBrazilBulgariaBurma / MyanmarCambodiaCameroonCanadaCaribbeanCentral AmericaChileChinaColombiaCongoCosta RicaCroatiaCubaCzechoslovakiaDenmarkDominicaDominican RepublicEastern AfricaEastern AsiaEastern EuropeEcuadorEgyptEl SalvadorEnglandEritreaEthiopiaEuropeFijiFranceGermanyGhanaGreeceGuatemalaGuyanaHaitiHondurasHong KongHungaryIndiaIndonesiaIranIraqIrelandIsraelItalyJamaicaJapanJordanKazakhstanKenyaKoreaKuwaitLaosLatin AmericaLatviaLebanonLiberiaLithuaniaMalaysiaMexicoMiddle AfricaMoldovaMoroccoNepalNetherlandsNicaraguaNigeriaNorth MacedoniaNorthern AfricaNorthern EuropeNorwayOceaniaPakistanPanamaPeruPhilippinesPolandPortugalRomaniaRussiaSaudi ArabiaScotlandSenegalSerbiaSierra LeoneSingaporeSomaliaSouth AfricaSouth AmericaSouth Central AsiaSouth Eastern AsiaSouthern EuropeSpainSri LankaSudanSwedenSwitzerlandSyriaTaiwanThailandTrinidad and TobagoTurkeyUgandaUkraineUruguayUzbekistanVenezuelaVietnamWest IndiesWestern AfricaWestern AsiaWestern EuropeYemenZaireZimbabwe
Income
Income (Families)
Income (Households)
Poverty
Poverty (Families)
Unemployment
Employment Occupations
Employment Industries
Employer Class
Commute Time
Commute Means
School Enrollment
Education by Degree Field
Occupancy
Finances
Physical Characteristics
Chicago
Compare Zip Codes
Comparison Subject

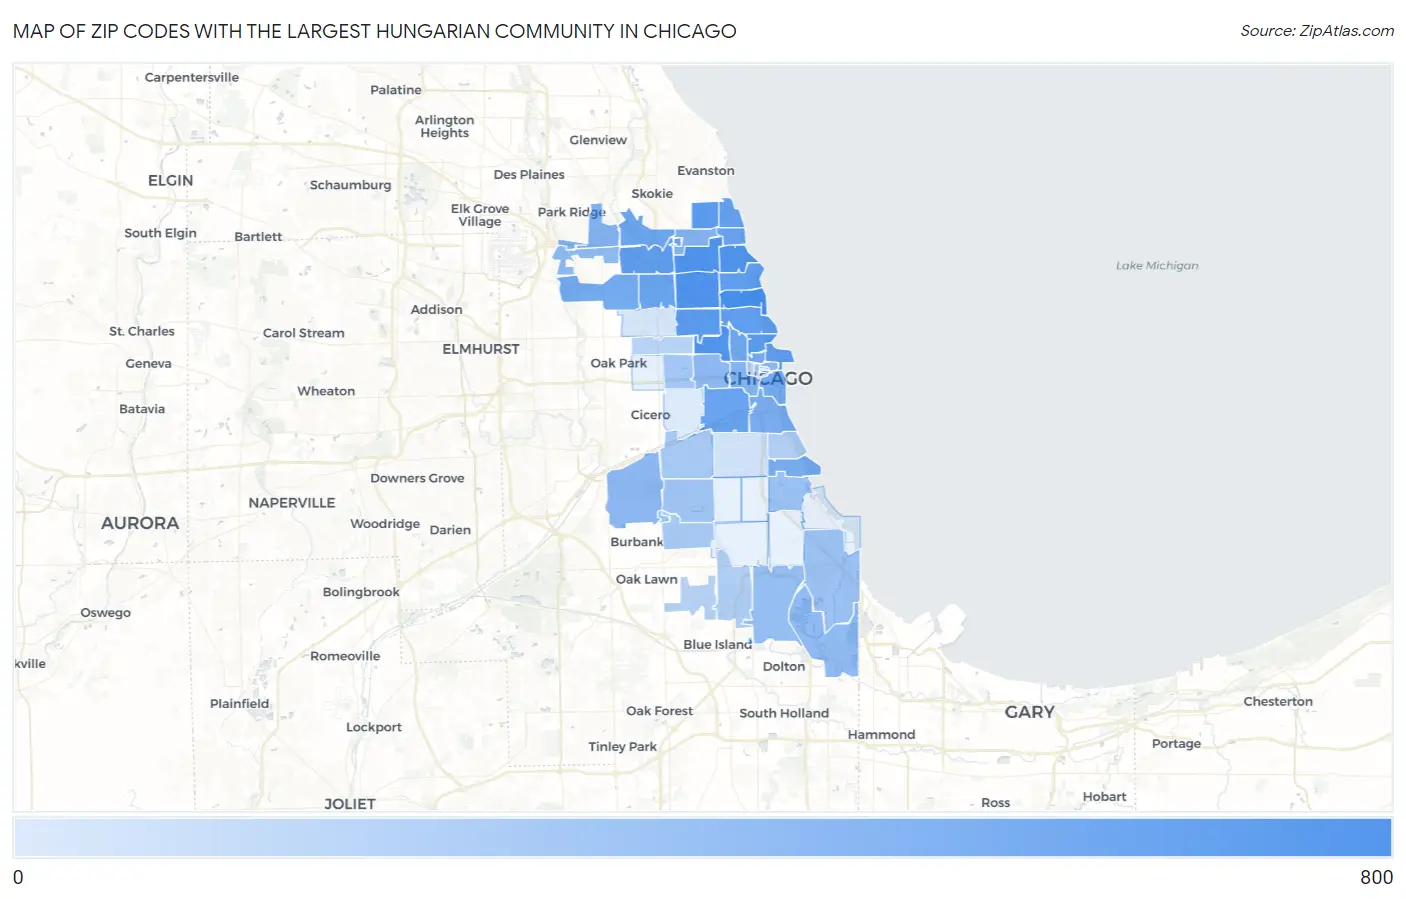
Map of Zip Codes with the Largest Hungarian Community in Chicago

0
800
Zip Codes with the Largest Hungarian Community in Chicago Map

Zip Codes with the Largest Hungarian Community in Chicago, IL

Zip Code Hungarian vs State vs National
1.6065774241,469(1.79%)#11,294,135(0.06%)#107
2.6061858341,469(1.41%)#31,294,135(0.05%)#196
3.6062557741,469(1.39%)#41,294,135(0.04%)#201
4.6064055741,469(1.34%)#51,294,135(0.04%)#213
5.6062253841,469(1.30%)#61,294,135(0.04%)#236
6.6061040641,469(0.98%)#101,294,135(0.03%)#430
7.6064536841,469(0.89%)#141,294,135(0.03%)#523
8.6064735741,469(0.86%)#151,294,135(0.03%)#552
9.6061330941,469(0.75%)#171,294,135(0.02%)#749
10.6063030541,469(0.74%)#181,294,135(0.02%)#767
11.6061430441,469(0.73%)#191,294,135(0.02%)#771
12.6061129841,469(0.72%)#221,294,135(0.02%)#802
13.6062628741,469(0.69%)#241,294,135(0.02%)#848
14.6066024841,469(0.60%)#291,294,135(0.02%)#1,104
15.6064123041,469(0.55%)#381,294,135(0.02%)#1,270
16.6060822041,469(0.53%)#411,294,135(0.02%)#1,372
17.6064619041,469(0.46%)#571,294,135(0.01%)#1,713
18.6064217641,469(0.42%)#691,294,135(0.01%)#1,921
19.6065415741,469(0.38%)#831,294,135(0.01%)#2,237
20.6063415441,469(0.37%)#851,294,135(0.01%)#2,292
21.6060514741,469(0.35%)#911,294,135(0.01%)#2,430
22.6061513641,469(0.33%)#991,294,135(0.01%)#2,661
23.6061612441,469(0.30%)#1121,294,135(0.01%)#2,951
24.606319341,469(0.22%)#1521,294,135(0.01%)#3,949
25.606599241,469(0.22%)#1531,294,135(0.01%)#3,985
26.606079041,469(0.22%)#1581,294,135(0.01%)#4,076
27.606386741,469(0.16%)#1881,294,135(0.01%)#5,156
28.606126741,469(0.16%)#1891,294,135(0.01%)#5,169
29.606015941,469(0.14%)#2091,294,135(0.00%)#5,695
30.606335641,469(0.14%)#2181,294,135(0.00%)#5,896
31.606565441,469(0.13%)#2221,294,135(0.00%)#6,015
32.606284941,469(0.12%)#2321,294,135(0.00%)#6,339
33.606173741,469(0.09%)#2661,294,135(0.00%)#7,330
34.606373641,469(0.09%)#2681,294,135(0.00%)#7,447
35.606293241,469(0.08%)#2801,294,135(0.00%)#7,861
36.606243041,469(0.07%)#2861,294,135(0.00%)#8,102
37.606322541,469(0.06%)#3041,294,135(0.00%)#8,677
38.606522441,469(0.06%)#3101,294,135(0.00%)#8,809
39.606431841,469(0.04%)#3511,294,135(0.00%)#9,739
40.606061841,469(0.04%)#3601,294,135(0.00%)#9,882
41.606531641,469(0.04%)#3731,294,135(0.00%)#10,142
42.606611641,469(0.04%)#3741,294,135(0.00%)#10,188
43.606511341,469(0.03%)#3991,294,135(0.00%)#10,761
44.606551341,469(0.03%)#4011,294,135(0.00%)#10,787
45.606031141,469(0.03%)#4291,294,135(0.00%)#11,514
46.60609541,469(0.01%)#5011,294,135(0.00%)#13,228
47.60639441,469(0.01%)#5231,294,135(0.00%)#13,598
48.60623341,469(0.01%)#5411,294,135(0.00%)#13,989

Common Questions

What are the Top 10 Zip Codes with the Largest Hungarian Community in Chicago, IL?
Top 10 Zip Codes with the Largest Hungarian Community in Chicago, IL are:
#1
742
#2
583
#3
577
#4
557
#5
538
#6
406
#7
368
#8
357
#9
309
#10
305
What zip code has the Largest Hungarian Community in Chicago, IL?
60657 has the Largest Hungarian Community in Chicago, IL with 742.
What is the Total Hungarian Population in Chicago, IL?
Total Hungarian Population in Chicago is 8,341.
What is the Total Hungarian Population in Illinois?
Total Hungarian Population in Illinois is 41,469.
What is the Total Hungarian Population in the United States?
Total Hungarian Population in the United States is 1,294,135.