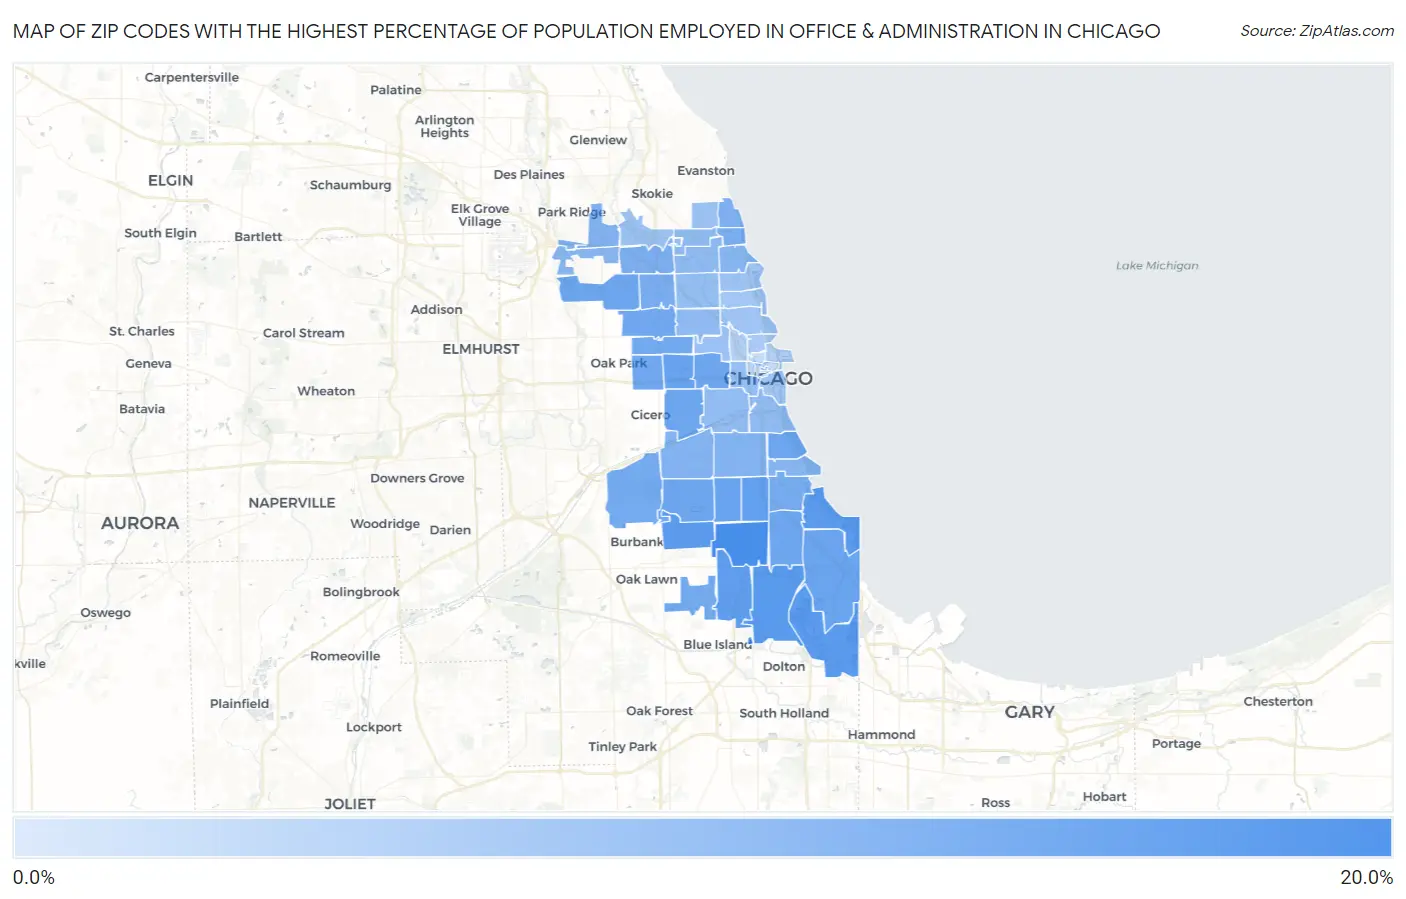
Zip Codes with the Highest Percentage of Population Employed in Office & Administration in Chicago, IL
RELATED REPORTS & OPTIONS
Office & Administration
Chicago
Compare Zip Codes
Map of Zip Codes with the Highest Percentage of Population Employed in Office & Administration in Chicago
1.1%
16.5%
Zip Codes with the Highest Percentage of Population Employed in Office & Administration in Chicago, IL
| Zip Code | % Employed | vs State | vs National | |
| 1. | 60620 | 16.5% | 10.8%(+5.77)#150 | 10.9%(+5.67)#3,148 |
| 2. | 60628 | 14.9% | 10.8%(+4.11)#228 | 10.9%(+4.02)#4,732 |
| 3. | 60649 | 14.6% | 10.8%(+3.80)#257 | 10.9%(+3.71)#5,174 |
| 4. | 60633 | 14.4% | 10.8%(+3.67)#267 | 10.9%(+3.58)#5,339 |
| 5. | 60652 | 14.2% | 10.8%(+3.42)#281 | 10.9%(+3.33)#5,714 |
| 6. | 60643 | 13.7% | 10.8%(+2.91)#318 | 10.9%(+2.82)#6,580 |
| 7. | 60621 | 13.6% | 10.8%(+2.83)#323 | 10.9%(+2.74)#6,726 |
| 8. | 60624 | 13.0% | 10.8%(+2.25)#381 | 10.9%(+2.16)#8,037 |
| 9. | 60636 | 12.8% | 10.8%(+2.06)#406 | 10.9%(+1.97)#8,478 |
| 10. | 60617 | 12.5% | 10.8%(+1.74)#450 | 10.9%(+1.65)#9,246 |
| 11. | 60634 | 12.4% | 10.8%(+1.62)#468 | 10.9%(+1.53)#9,607 |
| 12. | 60619 | 12.3% | 10.8%(+1.50)#485 | 10.9%(+1.41)#9,939 |
| 13. | 60629 | 12.2% | 10.8%(+1.47)#488 | 10.9%(+1.38)#10,027 |
| 14. | 60653 | 12.2% | 10.8%(+1.47)#489 | 10.9%(+1.38)#10,035 |
| 15. | 60623 | 12.2% | 10.8%(+1.47)#491 | 10.9%(+1.37)#10,055 |
| 16. | 60612 | 12.2% | 10.8%(+1.46)#492 | 10.9%(+1.37)#10,062 |
| 17. | 60644 | 12.1% | 10.8%(+1.34)#501 | 10.9%(+1.25)#10,421 |
| 18. | 60639 | 12.1% | 10.8%(+1.29)#507 | 10.9%(+1.19)#10,566 |
| 19. | 60651 | 11.7% | 10.8%(+0.941)#556 | 10.9%(+0.849)#11,606 |
| 20. | 60638 | 11.6% | 10.8%(+0.874)#566 | 10.9%(+0.782)#11,826 |
| 21. | 60655 | 11.6% | 10.8%(+0.800)#575 | 10.9%(+0.708)#12,057 |
| 22. | 60637 | 11.4% | 10.8%(+0.603)#598 | 10.9%(+0.511)#12,662 |
| 23. | 60641 | 11.1% | 10.8%(+0.303)#634 | 10.9%(+0.211)#13,627 |
| 24. | 60660 | 11.0% | 10.8%(+0.240)#646 | 10.9%(+0.149)#13,826 |
| 25. | 60626 | 10.7% | 10.8%(-0.106)#690 | 10.9%(-0.198)#14,946 |
| 26. | 60630 | 10.6% | 10.8%(-0.185)#697 | 10.9%(-0.277)#15,206 |
| 27. | 60632 | 10.1% | 10.8%(-0.668)#761 | 10.9%(-0.760)#16,809 |
| 28. | 60631 | 10.0% | 10.8%(-0.753)#778 | 10.9%(-0.845)#17,087 |
| 29. | 60609 | 10.0% | 10.8%(-0.774)#782 | 10.9%(-0.865)#17,181 |
| 30. | 60615 | 9.7% | 10.8%(-1.07)#810 | 10.9%(-1.16)#18,095 |
| 31. | 60640 | 9.5% | 10.8%(-1.23)#838 | 10.9%(-1.33)#18,644 |
| 32. | 60656 | 9.4% | 10.8%(-1.38)#863 | 10.9%(-1.47)#19,134 |
| 33. | 60602 | 9.3% | 10.8%(-1.49)#880 | 10.9%(-1.59)#19,469 |
| 34. | 60647 | 8.7% | 10.8%(-2.04)#950 | 10.9%(-2.13)#21,081 |
| 35. | 60659 | 8.7% | 10.8%(-2.05)#954 | 10.9%(-2.15)#21,129 |
| 36. | 60625 | 8.7% | 10.8%(-2.08)#957 | 10.9%(-2.17)#21,201 |
| 37. | 60616 | 8.7% | 10.8%(-2.10)#958 | 10.9%(-2.19)#21,247 |
| 38. | 60608 | 8.5% | 10.8%(-2.30)#984 | 10.9%(-2.39)#21,794 |
| 39. | 60618 | 8.2% | 10.8%(-2.54)#1,006 | 10.9%(-2.63)#22,450 |
| 40. | 60607 | 7.9% | 10.8%(-2.88)#1,044 | 10.9%(-2.97)#23,302 |
| 41. | 60645 | 7.5% | 10.8%(-3.30)#1,082 | 10.9%(-3.39)#24,241 |
| 42. | 60622 | 7.4% | 10.8%(-3.37)#1,088 | 10.9%(-3.46)#24,415 |
| 43. | 60646 | 7.3% | 10.8%(-3.46)#1,099 | 10.9%(-3.55)#24,598 |
| 44. | 60613 | 7.3% | 10.8%(-3.47)#1,100 | 10.9%(-3.56)#24,618 |
| 45. | 60614 | 7.0% | 10.8%(-3.73)#1,125 | 10.9%(-3.82)#25,149 |
| 46. | 60605 | 6.9% | 10.8%(-3.91)#1,144 | 10.9%(-4.00)#25,481 |
| 47. | 60657 | 6.7% | 10.8%(-4.05)#1,158 | 10.9%(-4.14)#25,731 |
| 48. | 60610 | 6.0% | 10.8%(-4.72)#1,198 | 10.9%(-4.81)#26,780 |
| 49. | 60611 | 5.4% | 10.8%(-5.38)#1,225 | 10.9%(-5.48)#27,676 |
| 50. | 60642 | 5.2% | 10.8%(-5.60)#1,236 | 10.9%(-5.70)#27,946 |
| 51. | 60661 | 4.1% | 10.8%(-6.71)#1,275 | 10.9%(-6.80)#28,958 |
| 52. | 60654 | 3.6% | 10.8%(-7.20)#1,293 | 10.9%(-7.29)#29,322 |
| 53. | 60603 | 3.5% | 10.8%(-7.28)#1,295 | 10.9%(-7.37)#29,370 |
| 54. | 60601 | 3.2% | 10.8%(-7.56)#1,304 | 10.9%(-7.65)#29,549 |
| 55. | 60606 | 2.9% | 10.8%(-7.83)#1,309 | 10.9%(-7.92)#29,692 |
| 56. | 60604 | 1.1% | 10.8%(-9.65)#1,328 | 10.9%(-9.74)#30,354 |
1
Common Questions
What are the Top 10 Zip Codes with the Highest Percentage of Population Employed in Office & Administration in Chicago, IL?
Top 10 Zip Codes with the Highest Percentage of Population Employed in Office & Administration in Chicago, IL are:
What zip code has the Highest Percentage of Population Employed in Office & Administration in Chicago, IL?
60620 has the Highest Percentage of Population Employed in Office & Administration in Chicago, IL with 16.5%.
What is the Percentage of Population Employed in Office & Administration in Chicago, IL?
Percentage of Population Employed in Office & Administration in Chicago is 9.9%.
What is the Percentage of Population Employed in Office & Administration in Illinois?
Percentage of Population Employed in Office & Administration in Illinois is 10.8%.
What is the Percentage of Population Employed in Office & Administration in the United States?
Percentage of Population Employed in Office & Administration in the United States is 10.9%.