Zip Codes with the Highest Percentage of Population Employed in Office & Administration in Davenport, IA
RELATED REPORTS & OPTIONS
Office & Administration
Davenport
Compare Zip Codes
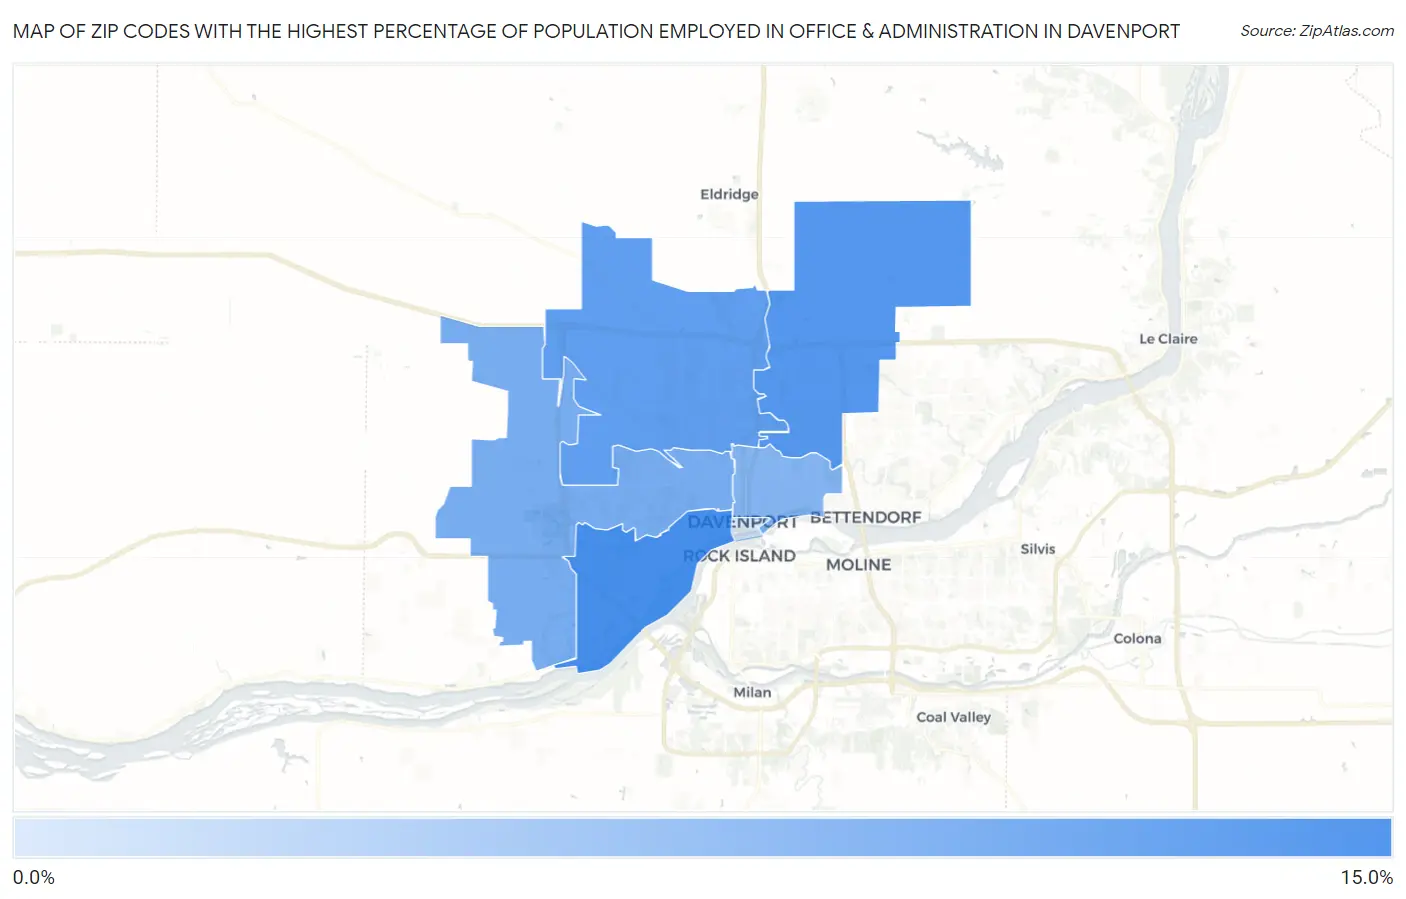
Map of Zip Codes with the Highest Percentage of Population Employed in Office & Administration in Davenport
3.7%
13.4%
Zip Codes with the Highest Percentage of Population Employed in Office & Administration in Davenport, IA
| Zip Code | % Employed | vs State | vs National | |
| 1. | 52802 | 13.4% | 10.6%(+2.74)#210 | 10.9%(+2.52)#7,208 |
| 2. | 52807 | 12.4% | 10.6%(+1.74)#286 | 10.9%(+1.52)#9,623 |
| 3. | 52806 | 11.7% | 10.6%(+1.03)#334 | 10.9%(+0.812)#11,726 |
| 4. | 52804 | 10.1% | 10.6%(-0.567)#471 | 10.9%(-0.787)#16,907 |
| 5. | 52803 | 9.3% | 10.6%(-1.36)#544 | 10.9%(-1.58)#19,438 |
| 6. | 52801 | 3.7% | 10.6%(-6.98)#879 | 10.9%(-7.20)#29,263 |
1
Common Questions
What are the Top 5 Zip Codes with the Highest Percentage of Population Employed in Office & Administration in Davenport, IA?
Top 5 Zip Codes with the Highest Percentage of Population Employed in Office & Administration in Davenport, IA are:
What zip code has the Highest Percentage of Population Employed in Office & Administration in Davenport, IA?
52802 has the Highest Percentage of Population Employed in Office & Administration in Davenport, IA with 13.4%.
What is the Percentage of Population Employed in Office & Administration in Davenport, IA?
Percentage of Population Employed in Office & Administration in Davenport is 10.8%.
What is the Percentage of Population Employed in Office & Administration in Iowa?
Percentage of Population Employed in Office & Administration in Iowa is 10.6%.
What is the Percentage of Population Employed in Office & Administration in the United States?
Percentage of Population Employed in Office & Administration in the United States is 10.9%.