Zip Codes with the Highest Percentage of Population Employed in Administrative & Support Services in Davenport, IA
RELATED REPORTS & OPTIONS
Administrative & Support Services
Davenport
Compare Zip Codes
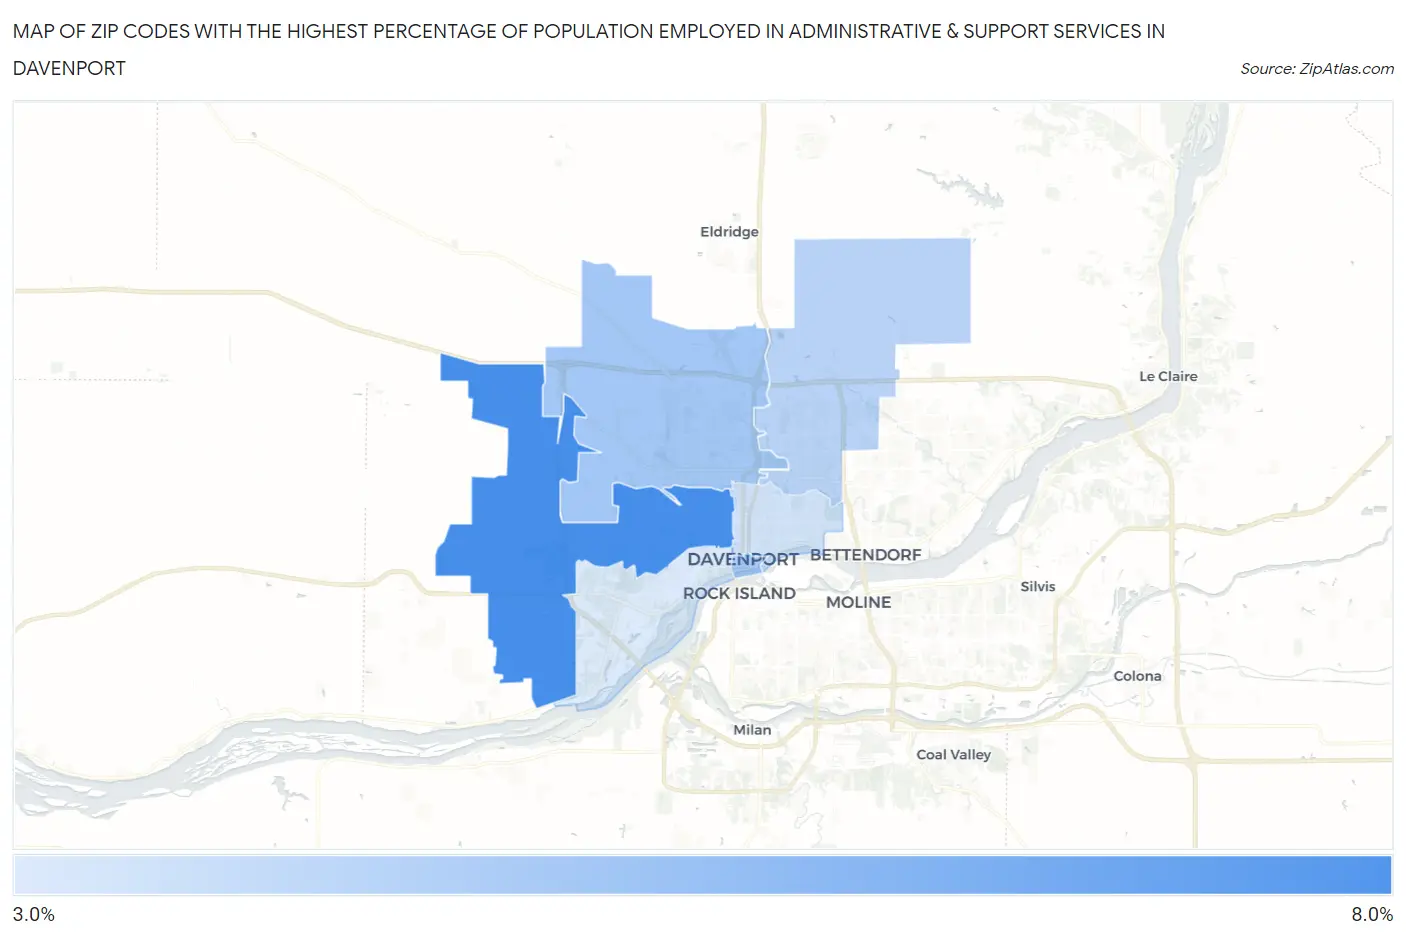
Map of Zip Codes with the Highest Percentage of Population Employed in Administrative & Support Services in Davenport
3.1%
6.1%
Zip Codes with the Highest Percentage of Population Employed in Administrative & Support Services in Davenport, IA
| Zip Code | % Employed | vs State | vs National | |
| 1. | 52804 | 6.1% | 3.0%(+3.09)#79 | 4.1%(+1.97)#4,563 |
| 2. | 52806 | 4.3% | 3.0%(+1.23)#174 | 4.1%(+0.107)#9,608 |
| 3. | 52801 | 4.1% | 3.0%(+1.02)#198 | 4.1%(-0.098)#10,463 |
| 4. | 52807 | 3.8% | 3.0%(+0.765)#212 | 4.1%(-0.356)#11,562 |
| 5. | 52803 | 3.3% | 3.0%(+0.261)#269 | 4.1%(-0.860)#14,000 |
| 6. | 52802 | 3.1% | 3.0%(+0.047)#294 | 4.1%(-1.07)#15,120 |
1
Common Questions
What are the Top 5 Zip Codes with the Highest Percentage of Population Employed in Administrative & Support Services in Davenport, IA?
Top 5 Zip Codes with the Highest Percentage of Population Employed in Administrative & Support Services in Davenport, IA are:
What zip code has the Highest Percentage of Population Employed in Administrative & Support Services in Davenport, IA?
52804 has the Highest Percentage of Population Employed in Administrative & Support Services in Davenport, IA with 6.1%.
What is the Percentage of Population Employed in Administrative & Support Services in Davenport, IA?
Percentage of Population Employed in Administrative & Support Services in Davenport is 4.3%.
What is the Percentage of Population Employed in Administrative & Support Services in Iowa?
Percentage of Population Employed in Administrative & Support Services in Iowa is 3.0%.
What is the Percentage of Population Employed in Administrative & Support Services in the United States?
Percentage of Population Employed in Administrative & Support Services in the United States is 4.1%.