Zip Codes with the Highest Percentage of Immigrants from Korea in Davenport, IA
RELATED REPORTS & OPTIONS
Korea
Davenport
Compare Zip Codes
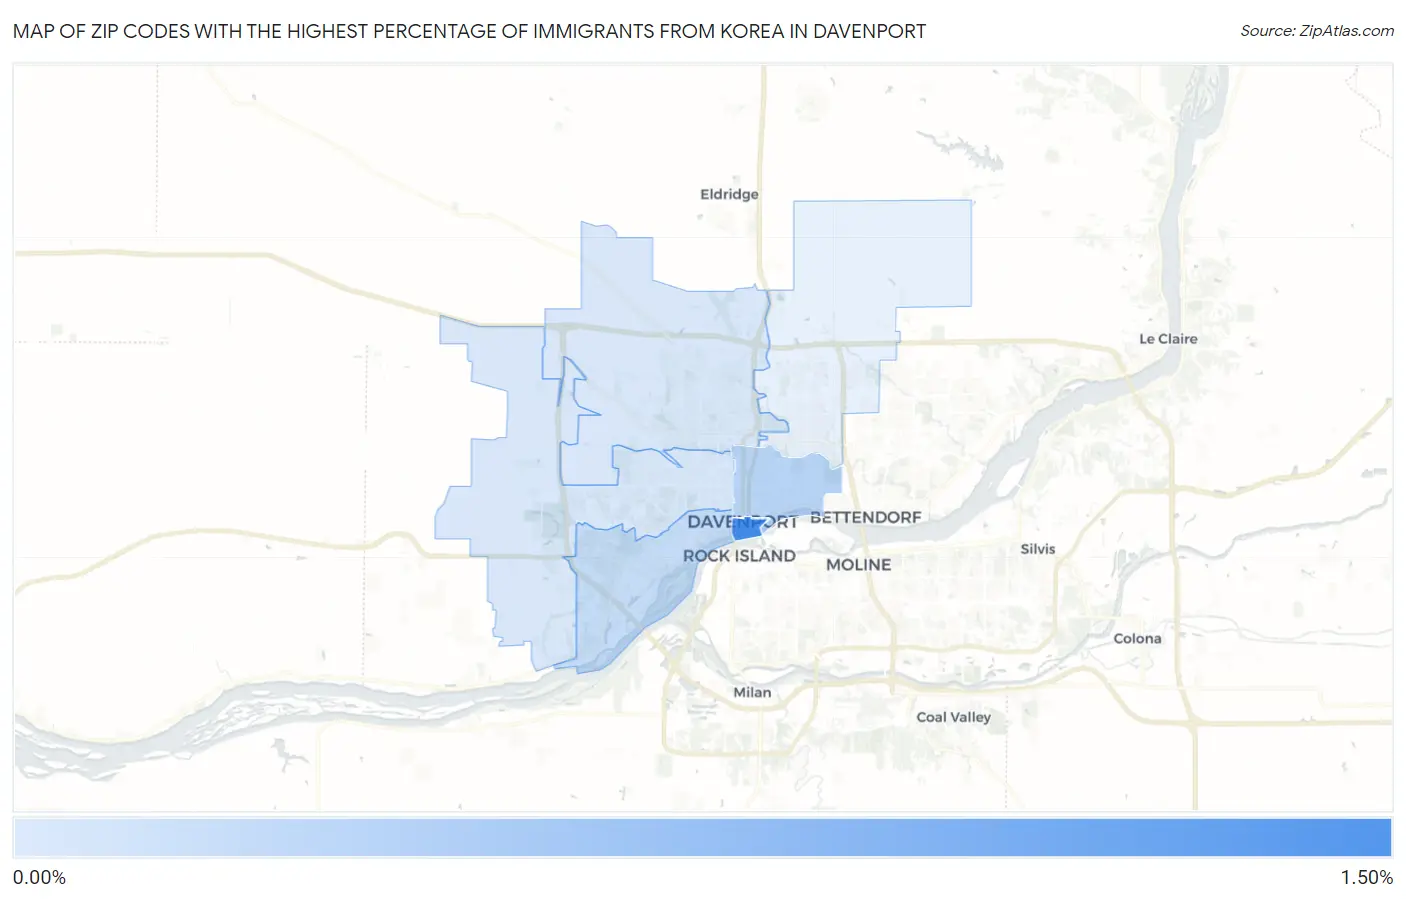
Map of Zip Codes with the Highest Percentage of Immigrants from Korea in Davenport
0.032%
1.38%
Zip Codes with the Highest Percentage of Immigrants from Korea in Davenport, IA
| Zip Code | Korea | vs State | vs National | |
| 1. | 52801 | 1.38% | 0.16%(+1.22)#8 | 0.31%(+1.06)#640 |
| 2. | 52803 | 0.32% | 0.16%(+0.163)#56 | 0.31%(+0.012)#3,349 |
| 3. | 52802 | 0.22% | 0.16%(+0.058)#79 | 0.31%(-0.093)#4,460 |
| 4. | 52804 | 0.052% | 0.16%(-0.109)#130 | 0.31%(-0.260)#7,899 |
| 5. | 52806 | 0.032% | 0.16%(-0.129)#134 | 0.31%(-0.280)#8,545 |
1
Common Questions
What are the Top 5 Zip Codes with the Highest Percentage of Immigrants from Korea in Davenport, IA?
Top 5 Zip Codes with the Highest Percentage of Immigrants from Korea in Davenport, IA are:
What zip code has the Highest Percentage of Immigrants from Korea in Davenport, IA?
52801 has the Highest Percentage of Immigrants from Korea in Davenport, IA with 1.38%.
What is the Percentage of Immigrants from Korea in Davenport, IA?
Percentage of Immigrants from Korea in Davenport is 0.13%.
What is the Percentage of Immigrants from Korea in Iowa?
Percentage of Immigrants from Korea in Iowa is 0.16%.
What is the Percentage of Immigrants from Korea in the United States?
Percentage of Immigrants from Korea in the United States is 0.31%.