Zip Codes with the Highest Percentage of Population Employed in Real Estate, Rental & Leasing in Davenport, IA
RELATED REPORTS & OPTIONS
Real Estate, Rental & Leasing
Davenport
Compare Zip Codes
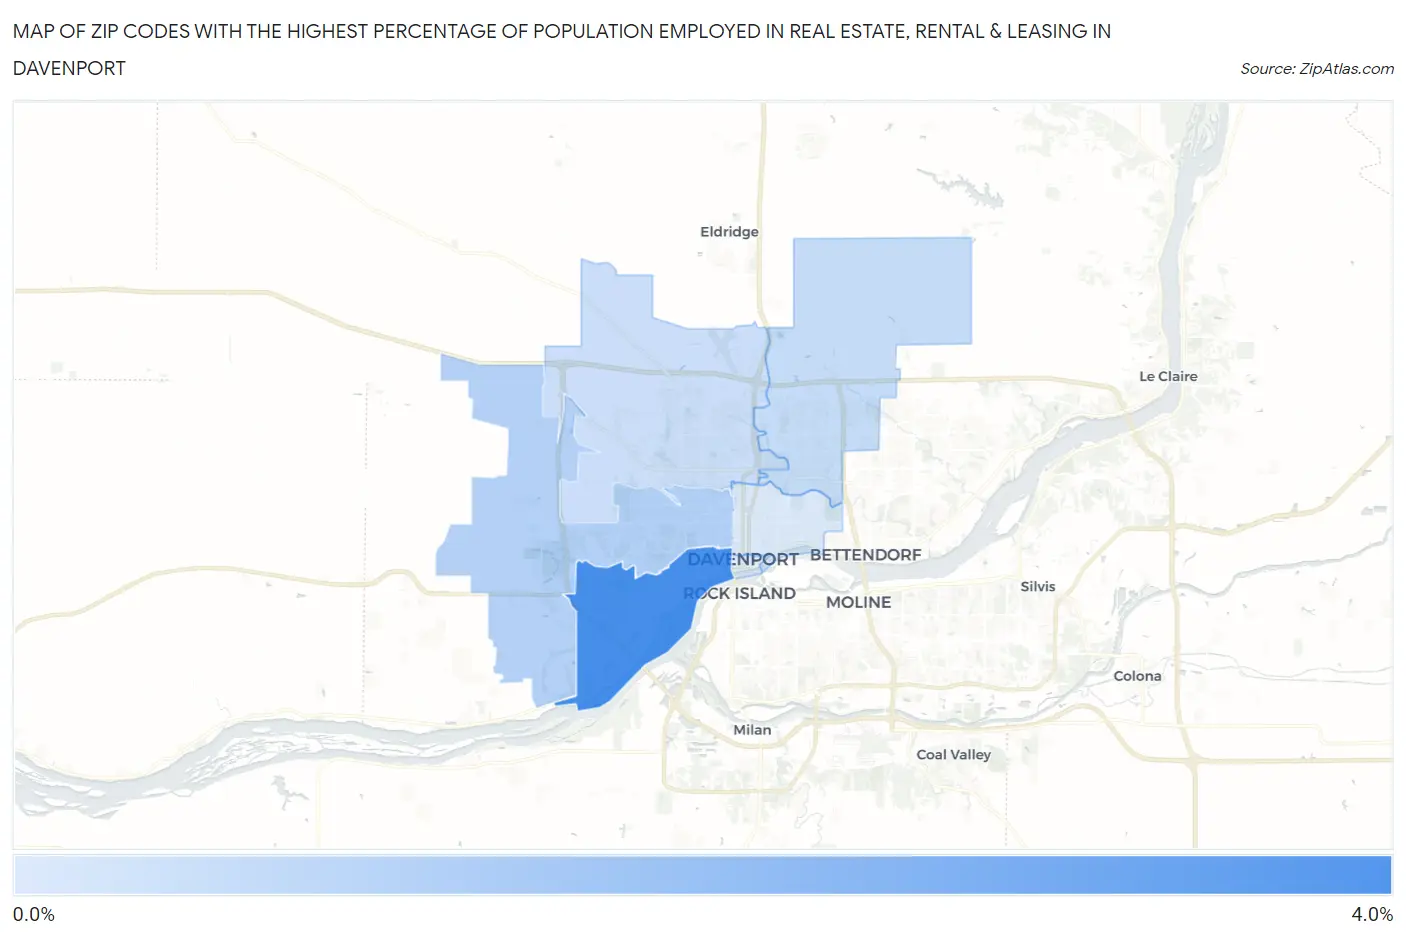
Map of Zip Codes with the Highest Percentage of Population Employed in Real Estate, Rental & Leasing in Davenport
0.68%
3.4%
Zip Codes with the Highest Percentage of Population Employed in Real Estate, Rental & Leasing in Davenport, IA
| Zip Code | % Employed | vs State | vs National | |
| 1. | 52802 | 3.4% | 1.1%(+2.29)#40 | 1.9%(+1.53)#2,973 |
| 2. | 52804 | 1.4% | 1.1%(+0.303)#163 | 1.9%(-0.455)#11,692 |
| 3. | 52807 | 1.1% | 1.1%(-0.018)#216 | 1.9%(-0.776)#14,152 |
| 4. | 52806 | 1.00% | 1.1%(-0.136)#248 | 1.9%(-0.894)#15,179 |
| 5. | 52803 | 0.68% | 1.1%(-0.452)#324 | 1.9%(-1.21)#17,628 |
1
Common Questions
What are the Top 5 Zip Codes with the Highest Percentage of Population Employed in Real Estate, Rental & Leasing in Davenport, IA?
Top 5 Zip Codes with the Highest Percentage of Population Employed in Real Estate, Rental & Leasing in Davenport, IA are:
What zip code has the Highest Percentage of Population Employed in Real Estate, Rental & Leasing in Davenport, IA?
52802 has the Highest Percentage of Population Employed in Real Estate, Rental & Leasing in Davenport, IA with 3.4%.
What is the Percentage of Population Employed in Real Estate, Rental & Leasing in Davenport, IA?
Percentage of Population Employed in Real Estate, Rental & Leasing in Davenport is 1.2%.
What is the Percentage of Population Employed in Real Estate, Rental & Leasing in Iowa?
Percentage of Population Employed in Real Estate, Rental & Leasing in Iowa is 1.1%.
What is the Percentage of Population Employed in Real Estate, Rental & Leasing in the United States?
Percentage of Population Employed in Real Estate, Rental & Leasing in the United States is 1.9%.