Zip Codes with the Most Immigrants from South Eastern Asia in Davenport, IA
RELATED REPORTS & OPTIONS
South Eastern Asia
Davenport
Compare Zip Codes
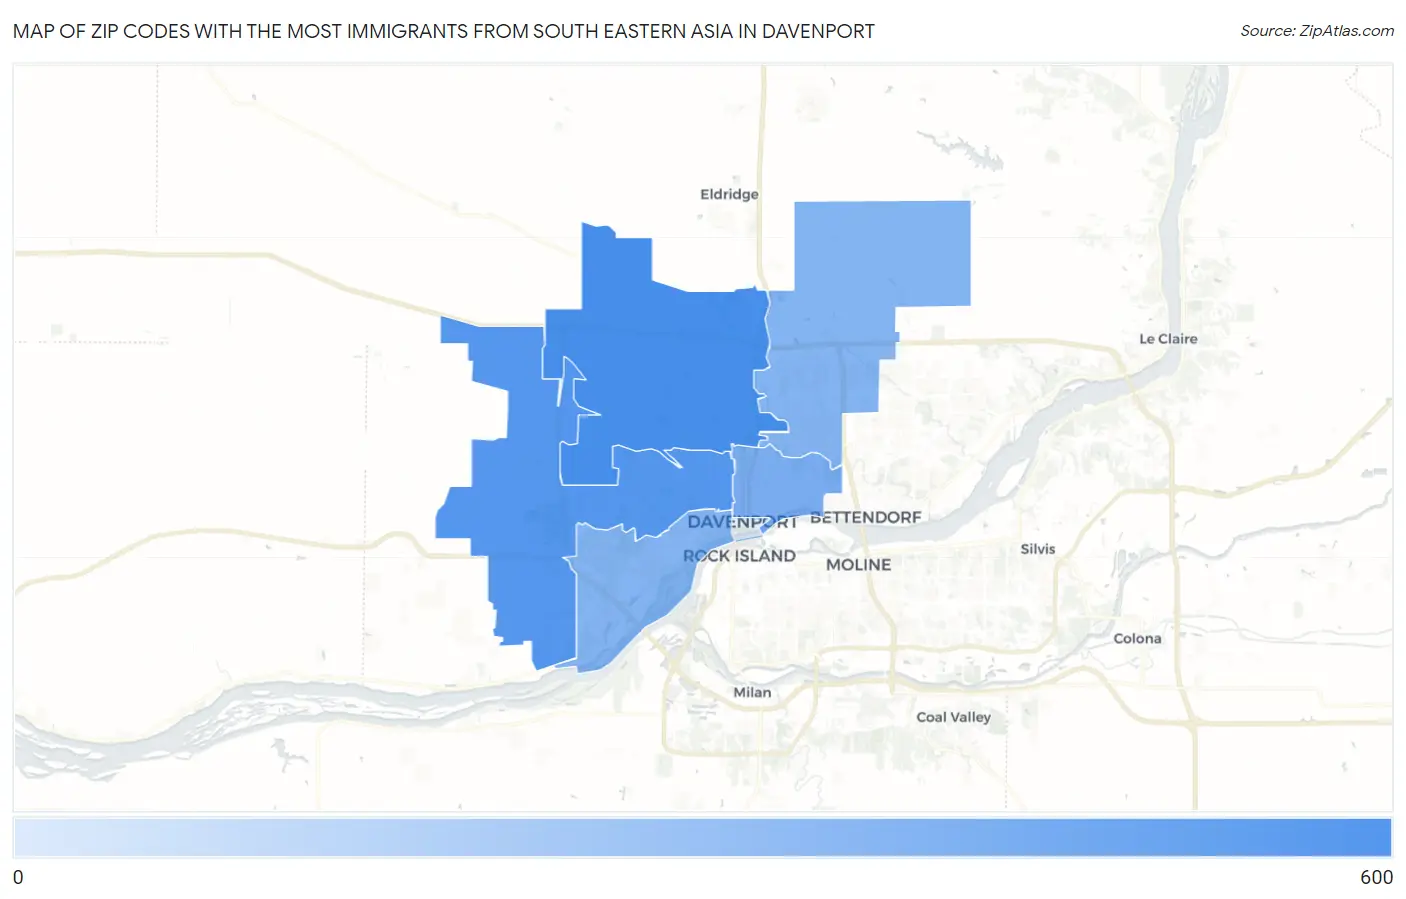
Map of Zip Codes with the Most Immigrants from South Eastern Asia in Davenport
40
503
Zip Codes with the Most Immigrants from South Eastern Asia in Davenport, IA
| Zip Code | South Eastern Asia | vs State | vs National | |
| 1. | 52806 | 503 | 25,692(1.96%)#16 | 4,292,058(0.01%)#1,921 |
| 2. | 52804 | 271 | 25,692(1.05%)#28 | 4,292,058(0.01%)#3,191 |
| 3. | 52803 | 59 | 25,692(0.23%)#73 | 4,292,058(0.00%)#7,323 |
| 4. | 52807 | 40 | 25,692(0.16%)#87 | 4,292,058(0.00%)#8,408 |
| 5. | 52802 | 40 | 25,692(0.16%)#89 | 4,292,058(0.00%)#8,425 |
1
Common Questions
What are the Top 5 Zip Codes with the Most Immigrants from South Eastern Asia in Davenport, IA?
Top 5 Zip Codes with the Most Immigrants from South Eastern Asia in Davenport, IA are:
What zip code has the Most Immigrants from South Eastern Asia in Davenport, IA?
52806 has the Most Immigrants from South Eastern Asia in Davenport, IA with 503.
What is the Total Immigrants from South Eastern Asia in Davenport, IA?
Total Immigrants from South Eastern Asia in Davenport is 913.
What is the Total Immigrants from South Eastern Asia in Iowa?
Total Immigrants from South Eastern Asia in Iowa is 25,692.
What is the Total Immigrants from South Eastern Asia in the United States?
Total Immigrants from South Eastern Asia in the United States is 4,292,058.