Zip Codes with the Highest Percentage of Population Employed in Life, Physical & Social Science in Davenport, IA
RELATED REPORTS & OPTIONS
Life, Physical & Social Science
Davenport
Compare Zip Codes
Map of Zip Codes with the Highest Percentage of Population Employed in Life, Physical & Social Science in Davenport
0.30%
1.6%
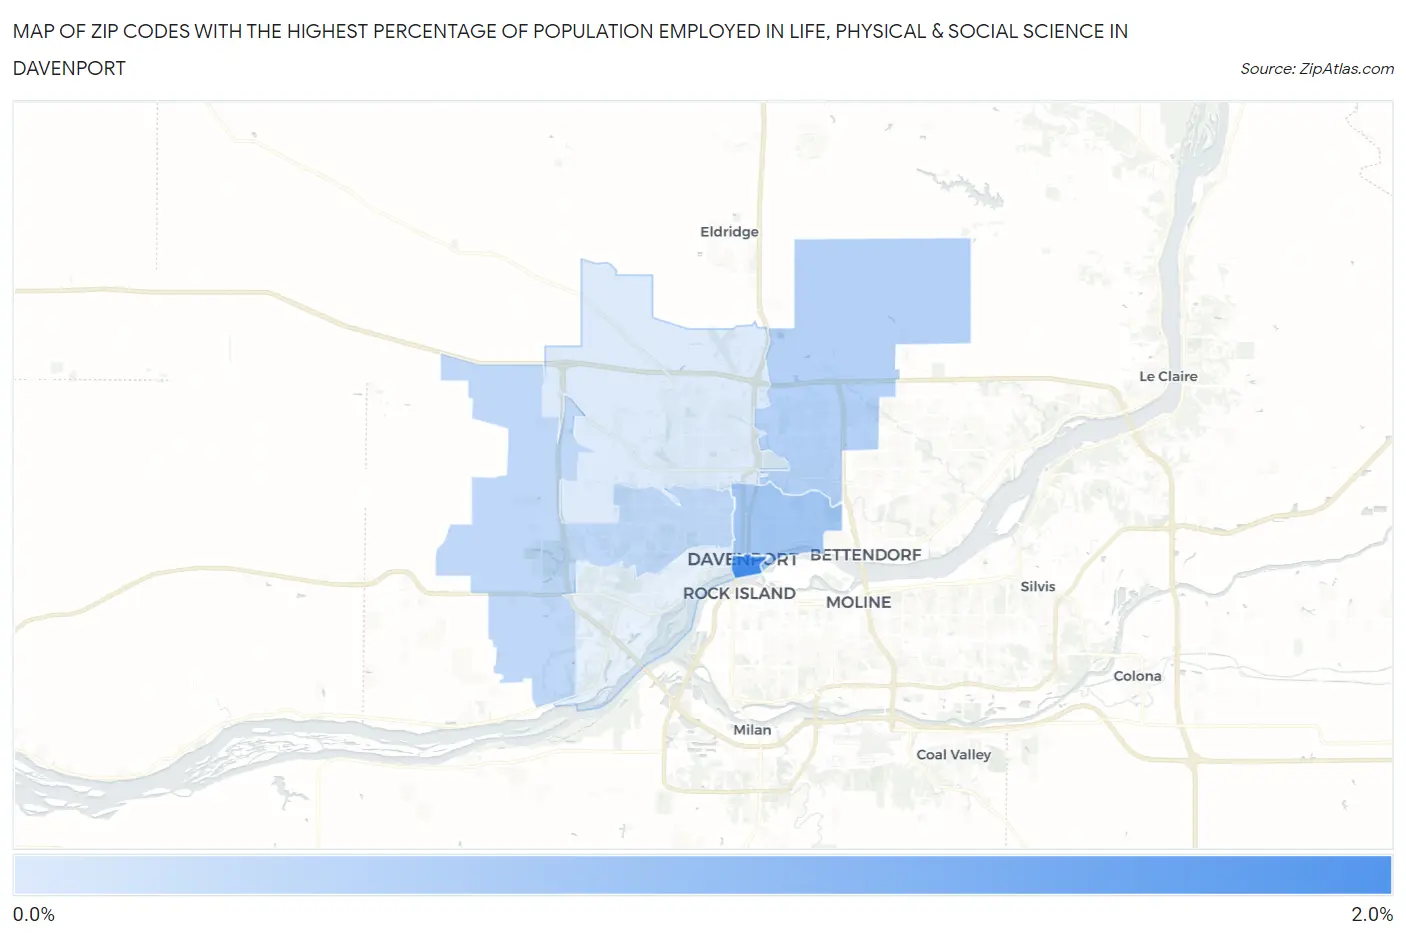
Zip Codes with the Highest Percentage of Population Employed in Life, Physical & Social Science in Davenport, IA
| Zip Code | % Employed | vs State | vs National | |
| 1. | 52801 | 1.6% | 0.95%(+0.624)#144 | 1.1%(+0.478)#5,298 |
| 2. | 52803 | 0.78% | 0.95%(-0.164)#292 | 1.1%(-0.310)#11,178 |
| 3. | 52807 | 0.66% | 0.95%(-0.287)#336 | 1.1%(-0.433)#12,562 |
| 4. | 52804 | 0.55% | 0.95%(-0.397)#367 | 1.1%(-0.543)#13,929 |
| 5. | 52806 | 0.30% | 0.95%(-0.642)#458 | 1.1%(-0.788)#17,028 |
1
Common Questions
What are the Top 5 Zip Codes with the Highest Percentage of Population Employed in Life, Physical & Social Science in Davenport, IA?
Top 5 Zip Codes with the Highest Percentage of Population Employed in Life, Physical & Social Science in Davenport, IA are:
What zip code has the Highest Percentage of Population Employed in Life, Physical & Social Science in Davenport, IA?
52801 has the Highest Percentage of Population Employed in Life, Physical & Social Science in Davenport, IA with 1.6%.
What is the Percentage of Population Employed in Life, Physical & Social Science in Davenport, IA?
Percentage of Population Employed in Life, Physical & Social Science in Davenport is 0.54%.
What is the Percentage of Population Employed in Life, Physical & Social Science in Iowa?
Percentage of Population Employed in Life, Physical & Social Science in Iowa is 0.95%.
What is the Percentage of Population Employed in Life, Physical & Social Science in the United States?
Percentage of Population Employed in Life, Physical & Social Science in the United States is 1.1%.