Zip Codes with the Highest Percentage of Population with a Degree in Visual and Performing Arts in Davenport, IA
RELATED REPORTS & OPTIONS
Visual and Performing Arts
Davenport
Compare Zip Codes
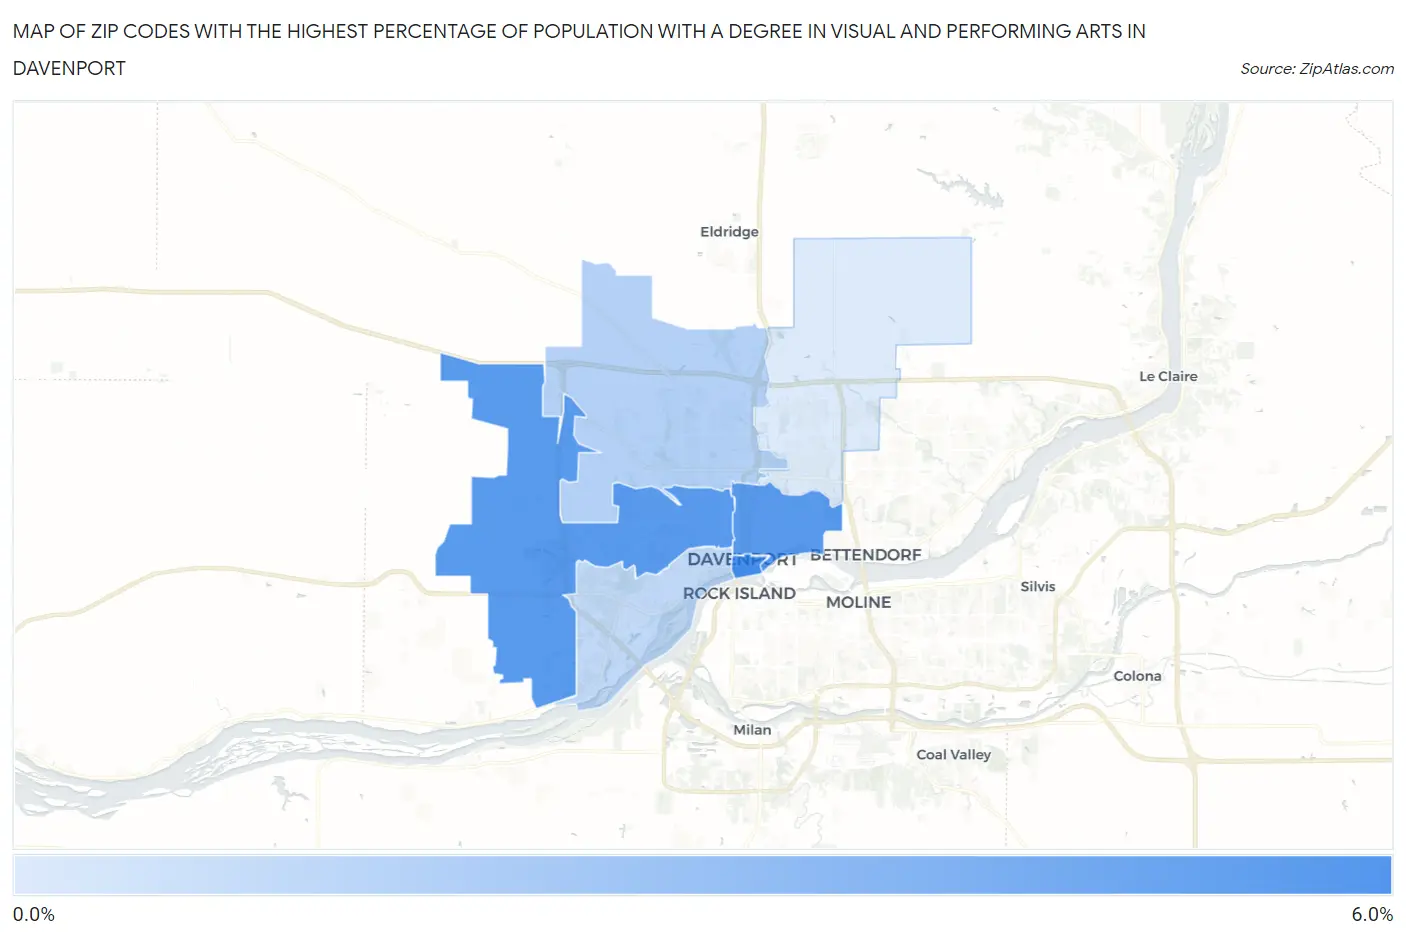
Map of Zip Codes with the Highest Percentage of Population with a Degree in Visual and Performing Arts in Davenport
0.64%
5.6%
Zip Codes with the Highest Percentage of Population with a Degree in Visual and Performing Arts in Davenport, IA
| Zip Code | % Graduates | vs State | vs National | |
| 1. | 52801 | 5.6% | 3.5%(+2.11)#114 | 4.3%(+1.36)#5,476 |
| 2. | 52804 | 5.1% | 3.5%(+1.60)#135 | 4.3%(+0.849)#6,422 |
| 3. | 52803 | 5.0% | 3.5%(+1.52)#140 | 4.3%(+0.774)#6,567 |
| 4. | 52806 | 2.0% | 3.5%(-1.51)#345 | 4.3%(-2.26)#16,478 |
| 5. | 52802 | 1.5% | 3.5%(-1.97)#388 | 4.3%(-2.71)#18,038 |
| 6. | 52807 | 0.64% | 3.5%(-2.86)#490 | 4.3%(-3.61)#20,488 |
1
Common Questions
What are the Top 5 Zip Codes with the Highest Percentage of Population with a Degree in Visual and Performing Arts in Davenport, IA?
Top 5 Zip Codes with the Highest Percentage of Population with a Degree in Visual and Performing Arts in Davenport, IA are:
What zip code has the Highest Percentage of Population with a Degree in Visual and Performing Arts in Davenport, IA?
52801 has the Highest Percentage of Population with a Degree in Visual and Performing Arts in Davenport, IA with 5.6%.
What is the Percentage of Population with a Degree in Visual and Performing Arts in Davenport, IA?
Percentage of Population with a Degree in Visual and Performing Arts in Davenport is 3.2%.
What is the Percentage of Population with a Degree in Visual and Performing Arts in Iowa?
Percentage of Population with a Degree in Visual and Performing Arts in Iowa is 3.5%.
What is the Percentage of Population with a Degree in Visual and Performing Arts in the United States?
Percentage of Population with a Degree in Visual and Performing Arts in the United States is 4.3%.