Zip Codes with the Highest Percentage of Population Employed in Installation, Maintenance & Repair in Davenport, IA
RELATED REPORTS & OPTIONS
Installation, Maintenance & Repair
Davenport
Compare Zip Codes
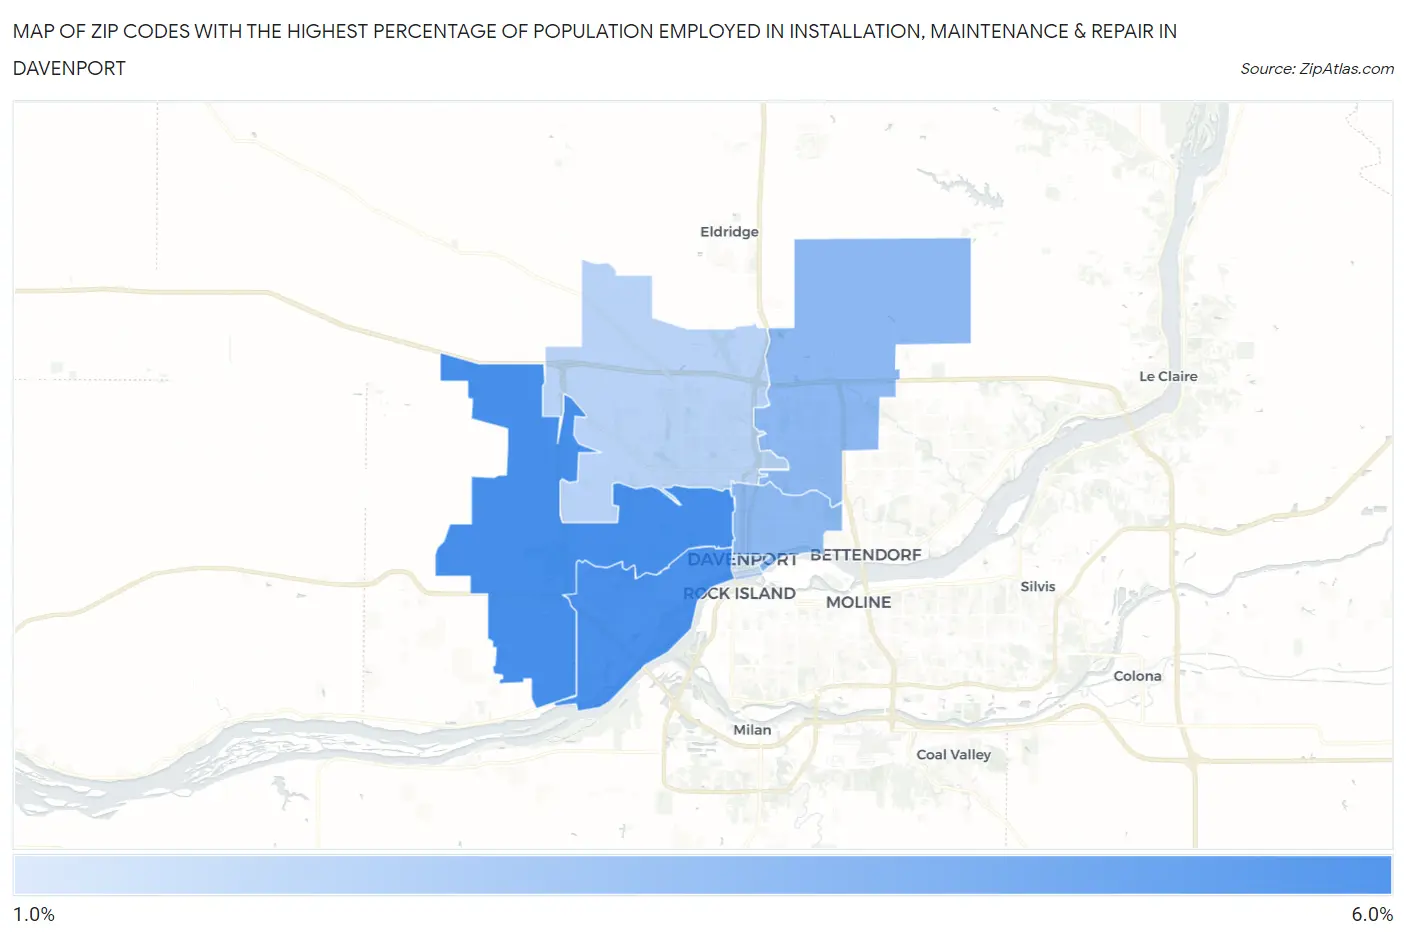
Map of Zip Codes with the Highest Percentage of Population Employed in Installation, Maintenance & Repair in Davenport
1.6%
5.3%
Zip Codes with the Highest Percentage of Population Employed in Installation, Maintenance & Repair in Davenport, IA
| Zip Code | % Employed | vs State | vs National | |
| 1. | 52804 | 5.3% | 3.5%(+1.82)#335 | 3.1%(+2.21)#7,861 |
| 2. | 52802 | 5.2% | 3.5%(+1.71)#349 | 3.1%(+2.10)#8,172 |
| 3. | 52807 | 3.6% | 3.5%(+0.104)#546 | 3.1%(+0.503)#14,283 |
| 4. | 52803 | 3.5% | 3.5%(+0.006)#566 | 3.1%(+0.405)#14,748 |
| 5. | 52806 | 2.5% | 3.5%(-0.976)#701 | 3.1%(-0.577)#19,601 |
| 6. | 52801 | 1.6% | 3.5%(-1.90)#795 | 3.1%(-1.50)#23,889 |
1
Common Questions
What are the Top 5 Zip Codes with the Highest Percentage of Population Employed in Installation, Maintenance & Repair in Davenport, IA?
Top 5 Zip Codes with the Highest Percentage of Population Employed in Installation, Maintenance & Repair in Davenport, IA are:
What zip code has the Highest Percentage of Population Employed in Installation, Maintenance & Repair in Davenport, IA?
52804 has the Highest Percentage of Population Employed in Installation, Maintenance & Repair in Davenport, IA with 5.3%.
What is the Percentage of Population Employed in Installation, Maintenance & Repair in Davenport, IA?
Percentage of Population Employed in Installation, Maintenance & Repair in Davenport is 3.8%.
What is the Percentage of Population Employed in Installation, Maintenance & Repair in Iowa?
Percentage of Population Employed in Installation, Maintenance & Repair in Iowa is 3.5%.
What is the Percentage of Population Employed in Installation, Maintenance & Repair in the United States?
Percentage of Population Employed in Installation, Maintenance & Repair in the United States is 3.1%.