Zip Codes with the Highest Percentage of Population Employed in Architecture & Engineering in Davenport, IA
RELATED REPORTS & OPTIONS
Architecture & Engineering
Davenport
Compare Zip Codes
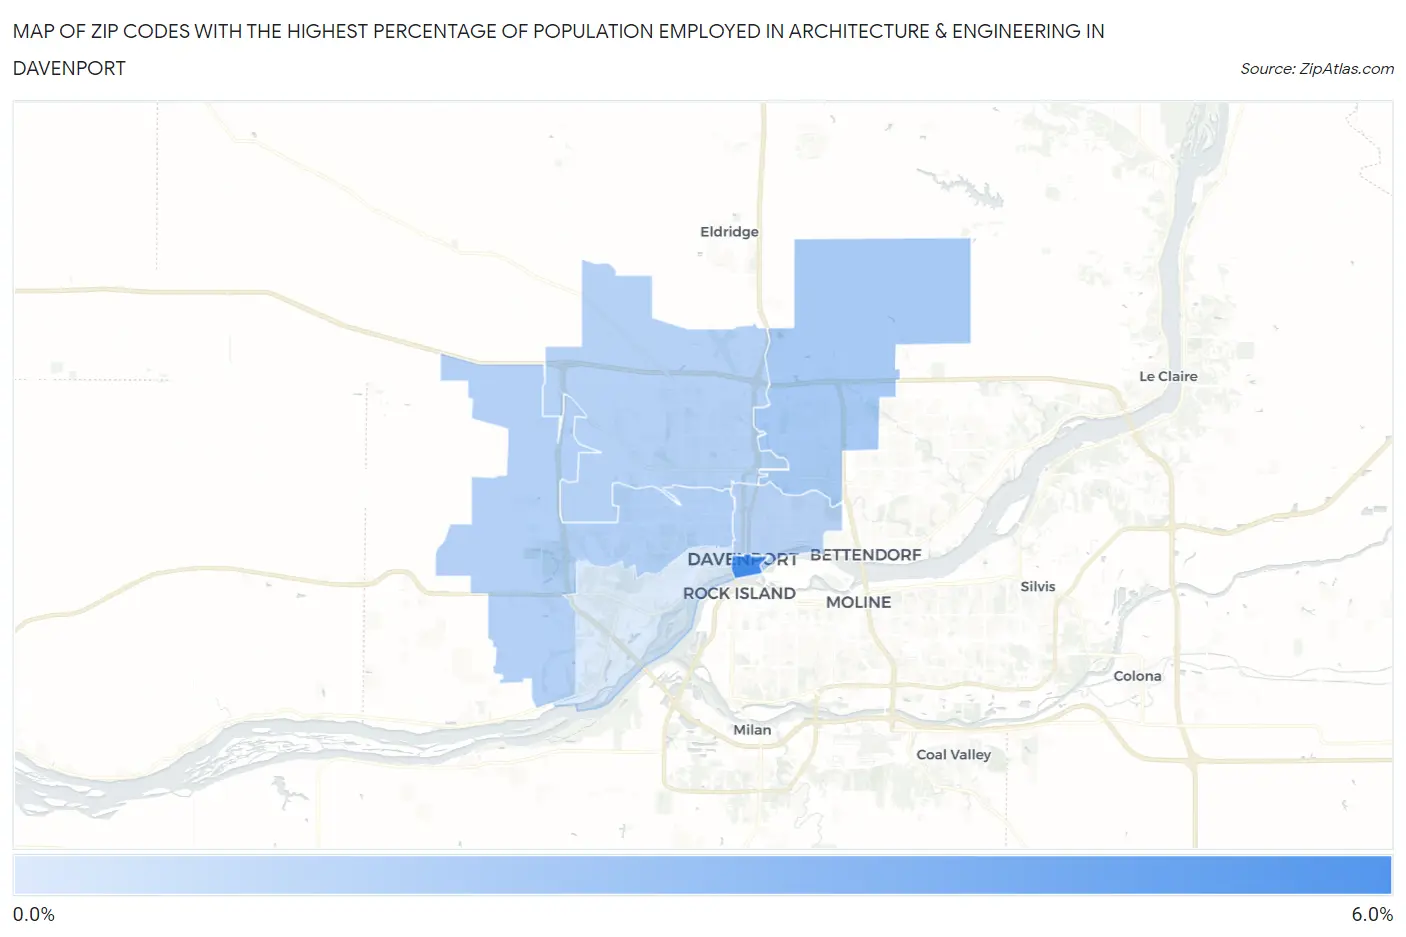
Map of Zip Codes with the Highest Percentage of Population Employed in Architecture & Engineering in Davenport
0.40%
5.4%
Zip Codes with the Highest Percentage of Population Employed in Architecture & Engineering in Davenport, IA
| Zip Code | % Employed | vs State | vs National | |
| 1. | 52801 | 5.4% | 1.8%(+3.58)#33 | 2.1%(+3.21)#1,414 |
| 2. | 52807 | 2.2% | 1.8%(+0.378)#205 | 2.1%(+0.012)#8,693 |
| 3. | 52804 | 1.7% | 1.8%(-0.054)#257 | 2.1%(-0.419)#11,292 |
| 4. | 52806 | 1.7% | 1.8%(-0.084)#265 | 2.1%(-0.450)#11,489 |
| 5. | 52803 | 1.6% | 1.8%(-0.188)#280 | 2.1%(-0.554)#12,220 |
| 6. | 52802 | 0.40% | 1.8%(-1.39)#575 | 2.1%(-1.75)#20,982 |
1
Common Questions
What are the Top 5 Zip Codes with the Highest Percentage of Population Employed in Architecture & Engineering in Davenport, IA?
Top 5 Zip Codes with the Highest Percentage of Population Employed in Architecture & Engineering in Davenport, IA are:
What zip code has the Highest Percentage of Population Employed in Architecture & Engineering in Davenport, IA?
52801 has the Highest Percentage of Population Employed in Architecture & Engineering in Davenport, IA with 5.4%.
What is the Percentage of Population Employed in Architecture & Engineering in Davenport, IA?
Percentage of Population Employed in Architecture & Engineering in Davenport is 1.7%.
What is the Percentage of Population Employed in Architecture & Engineering in Iowa?
Percentage of Population Employed in Architecture & Engineering in Iowa is 1.8%.
What is the Percentage of Population Employed in Architecture & Engineering in the United States?
Percentage of Population Employed in Architecture & Engineering in the United States is 2.1%.