Zip Codes with the Highest Percentage of Immigrants from Eastern Asia in Davenport, IA
RELATED REPORTS & OPTIONS
Eastern Asia
Davenport
Compare Zip Codes
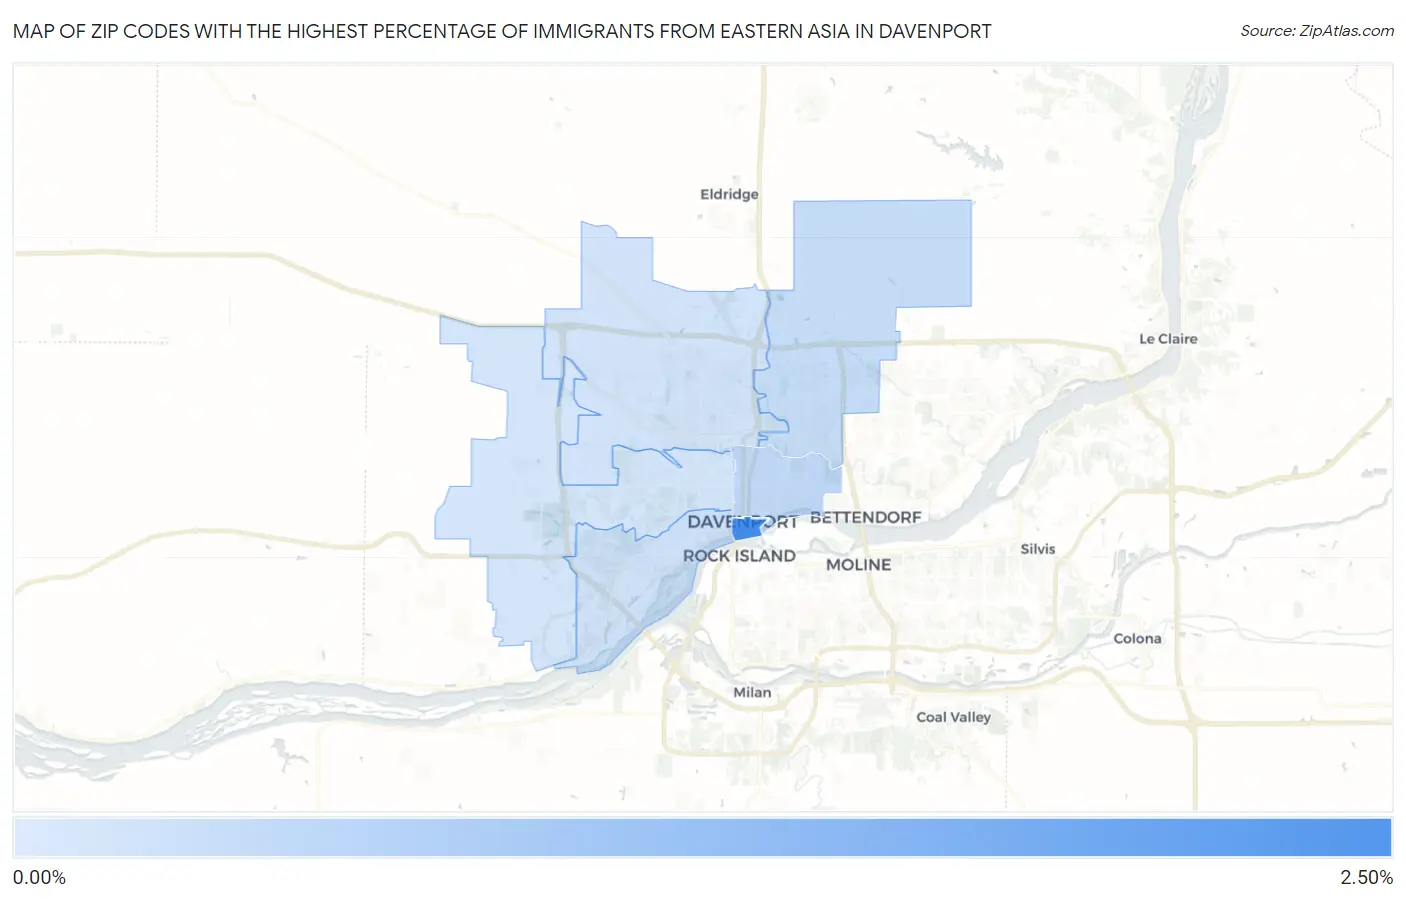
Map of Zip Codes with the Highest Percentage of Immigrants from Eastern Asia in Davenport
0.14%
2.32%
Zip Codes with the Highest Percentage of Immigrants from Eastern Asia in Davenport, IA
| Zip Code | Eastern Asia | vs State | vs National | |
| 1. | 52801 | 2.32% | 0.48%(+1.84)#16 | 1.28%(+1.04)#1,737 |
| 2. | 52803 | 0.42% | 0.48%(-0.059)#97 | 1.28%(-0.858)#7,380 |
| 3. | 52807 | 0.36% | 0.48%(-0.114)#109 | 1.28%(-0.913)#7,992 |
| 4. | 52802 | 0.22% | 0.48%(-0.257)#141 | 1.28%(-1.06)#9,961 |
| 5. | 52806 | 0.18% | 0.48%(-0.293)#158 | 1.28%(-1.09)#10,565 |
| 6. | 52804 | 0.14% | 0.48%(-0.339)#175 | 1.28%(-1.14)#11,406 |
1
Common Questions
What are the Top 5 Zip Codes with the Highest Percentage of Immigrants from Eastern Asia in Davenport, IA?
Top 5 Zip Codes with the Highest Percentage of Immigrants from Eastern Asia in Davenport, IA are:
What zip code has the Highest Percentage of Immigrants from Eastern Asia in Davenport, IA?
52801 has the Highest Percentage of Immigrants from Eastern Asia in Davenport, IA with 2.32%.
What is the Percentage of Immigrants from Eastern Asia in Davenport, IA?
Percentage of Immigrants from Eastern Asia in Davenport is 0.29%.
What is the Percentage of Immigrants from Eastern Asia in Iowa?
Percentage of Immigrants from Eastern Asia in Iowa is 0.48%.
What is the Percentage of Immigrants from Eastern Asia in the United States?
Percentage of Immigrants from Eastern Asia in the United States is 1.28%.