Immigrants from Uzbekistan vs Immigrants from Czechoslovakia Married-couple Households
COMPARE
Immigrants from Uzbekistan
Immigrants from Czechoslovakia
Married-couple Households
Married-couple Households Comparison
Immigrants from Uzbekistan
Immigrants from Czechoslovakia
45.4%
MARRIED-COUPLE HOUSEHOLDS
8.4/ 100
METRIC RATING
209th/ 347
METRIC RANK
47.8%
MARRIED-COUPLE HOUSEHOLDS
95.5/ 100
METRIC RATING
105th/ 347
METRIC RANK
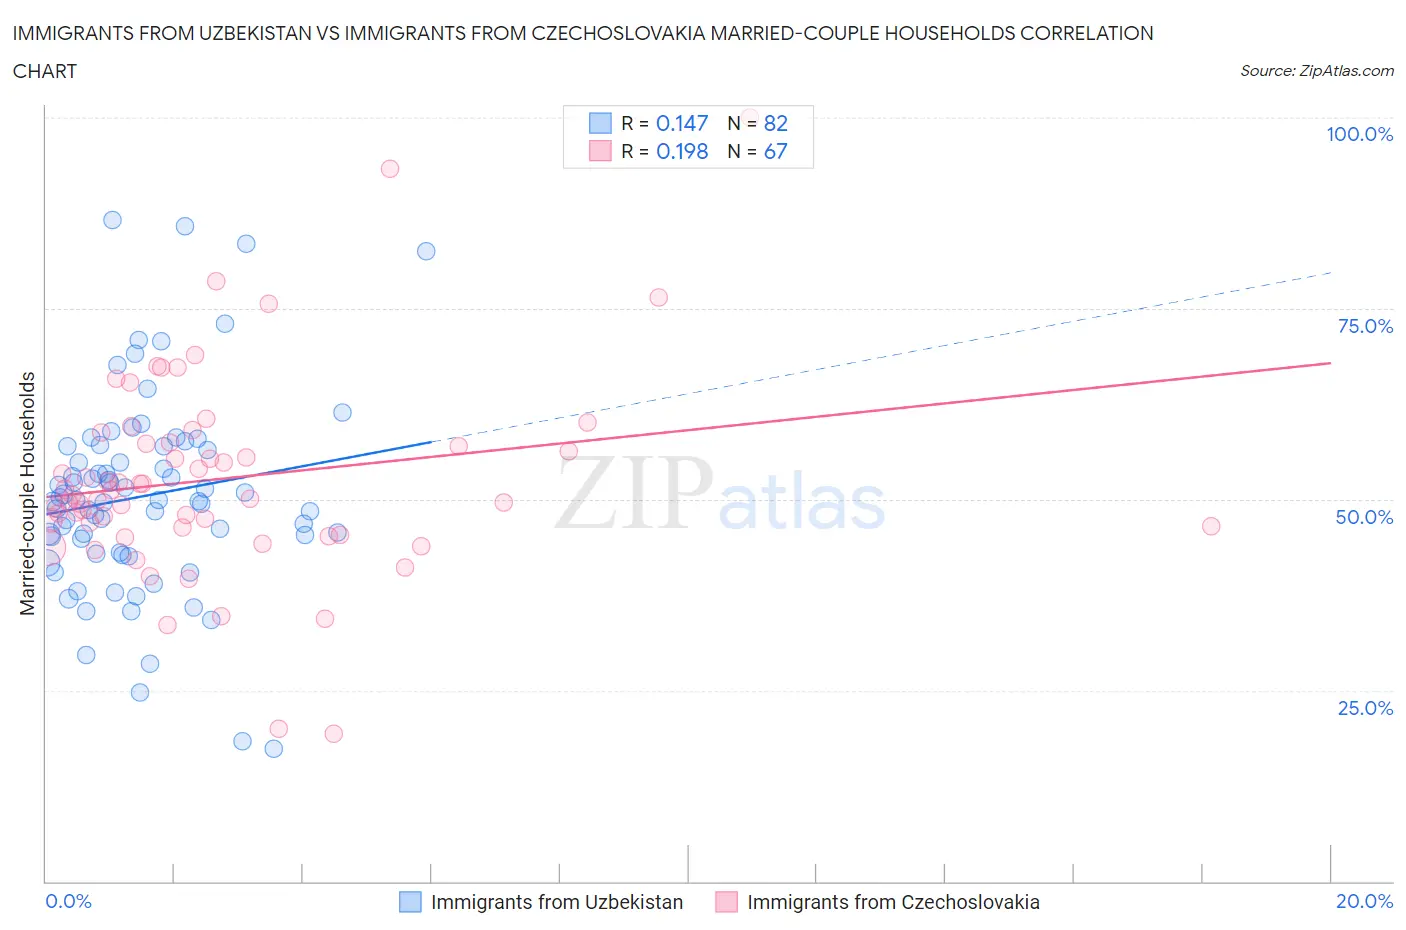
Immigrants from Uzbekistan vs Immigrants from Czechoslovakia Married-couple Households Correlation Chart
The statistical analysis conducted on geographies consisting of 118,716,463 people shows a poor positive correlation between the proportion of Immigrants from Uzbekistan and percentage of married-couple family households in the United States with a correlation coefficient (R) of 0.147 and weighted average of 45.4%. Similarly, the statistical analysis conducted on geographies consisting of 195,446,712 people shows a poor positive correlation between the proportion of Immigrants from Czechoslovakia and percentage of married-couple family households in the United States with a correlation coefficient (R) of 0.198 and weighted average of 47.8%, a difference of 5.2%.
Married-couple Households Correlation Summary
| Measurement | Immigrants from Uzbekistan | Immigrants from Czechoslovakia |
| Minimum | 17.4% | 19.3% |
| Maximum | 86.6% | 100.0% |
| Range | 69.2% | 80.7% |
| Mean | 50.4% | 52.7% |
| Median | 49.8% | 50.6% |
| Interquartile 25% (IQ1) | 43.1% | 46.3% |
| Interquartile 75% (IQ3) | 56.9% | 57.4% |
| Interquartile Range (IQR) | 13.9% | 11.1% |
| Standard Deviation (Sample) | 13.1% | 13.4% |
| Standard Deviation (Population) | 13.0% | 13.3% |
Similar Demographics by Married-couple Households
Demographics Similar to Immigrants from Uzbekistan by Married-couple Households
In terms of married-couple households, the demographic groups most similar to Immigrants from Uzbekistan are Hispanic or Latino (45.4%, a difference of 0.040%), Immigrants from France (45.4%, a difference of 0.050%), Cuban (45.4%, a difference of 0.090%), Immigrants from Spain (45.3%, a difference of 0.14%), and Uruguayan (45.5%, a difference of 0.23%).
| Demographics | Rating | Rank | Married-couple Households |
| Immigrants | Central America | 14.2 /100 | #202 | Poor 45.7% |
| Alaska Natives | 13.0 /100 | #203 | Poor 45.6% |
| Aleuts | 12.5 /100 | #204 | Poor 45.6% |
| Nepalese | 11.9 /100 | #205 | Poor 45.6% |
| Uruguayans | 10.4 /100 | #206 | Poor 45.5% |
| Immigrants | France | 8.8 /100 | #207 | Tragic 45.4% |
| Hispanics or Latinos | 8.7 /100 | #208 | Tragic 45.4% |
| Immigrants | Uzbekistan | 8.4 /100 | #209 | Tragic 45.4% |
| Cubans | 7.7 /100 | #210 | Tragic 45.4% |
| Immigrants | Spain | 7.3 /100 | #211 | Tragic 45.3% |
| Creek | 6.4 /100 | #212 | Tragic 45.3% |
| Yakama | 5.8 /100 | #213 | Tragic 45.2% |
| Japanese | 5.7 /100 | #214 | Tragic 45.2% |
| Immigrants | Nepal | 5.6 /100 | #215 | Tragic 45.2% |
| Immigrants | Portugal | 5.6 /100 | #216 | Tragic 45.2% |
Demographics Similar to Immigrants from Czechoslovakia by Married-couple Households
In terms of married-couple households, the demographic groups most similar to Immigrants from Czechoslovakia are Portuguese (47.8%, a difference of 0.010%), Immigrants from South Africa (47.8%, a difference of 0.10%), Slavic (47.8%, a difference of 0.11%), Hawaiian (47.8%, a difference of 0.11%), and Turkish (47.8%, a difference of 0.13%).
| Demographics | Rating | Rank | Married-couple Households |
| Immigrants | North Macedonia | 96.4 /100 | #98 | Exceptional 47.9% |
| Immigrants | Austria | 96.4 /100 | #99 | Exceptional 47.9% |
| Immigrants | Italy | 96.3 /100 | #100 | Exceptional 47.9% |
| Turks | 96.1 /100 | #101 | Exceptional 47.8% |
| Slavs | 96.0 /100 | #102 | Exceptional 47.8% |
| Hawaiians | 96.0 /100 | #103 | Exceptional 47.8% |
| Immigrants | South Africa | 96.0 /100 | #104 | Exceptional 47.8% |
| Immigrants | Czechoslovakia | 95.5 /100 | #105 | Exceptional 47.8% |
| Portuguese | 95.5 /100 | #106 | Exceptional 47.8% |
| Estonians | 94.7 /100 | #107 | Exceptional 47.7% |
| Immigrants | Japan | 94.4 /100 | #108 | Exceptional 47.7% |
| Immigrants | Jordan | 94.1 /100 | #109 | Exceptional 47.7% |
| Macedonians | 93.9 /100 | #110 | Exceptional 47.6% |
| Syrians | 93.9 /100 | #111 | Exceptional 47.6% |
| Peruvians | 93.8 /100 | #112 | Exceptional 47.6% |