Ethiopian vs Chippewa Married-couple Households
COMPARE
Ethiopian
Chippewa
Married-couple Households
Married-couple Households Comparison
Ethiopians
Chippewa
43.2%
MARRIED-COUPLE HOUSEHOLDS
0.1/ 100
METRIC RATING
273rd/ 347
METRIC RANK
42.1%
MARRIED-COUPLE HOUSEHOLDS
0.0/ 100
METRIC RATING
287th/ 347
METRIC RANK
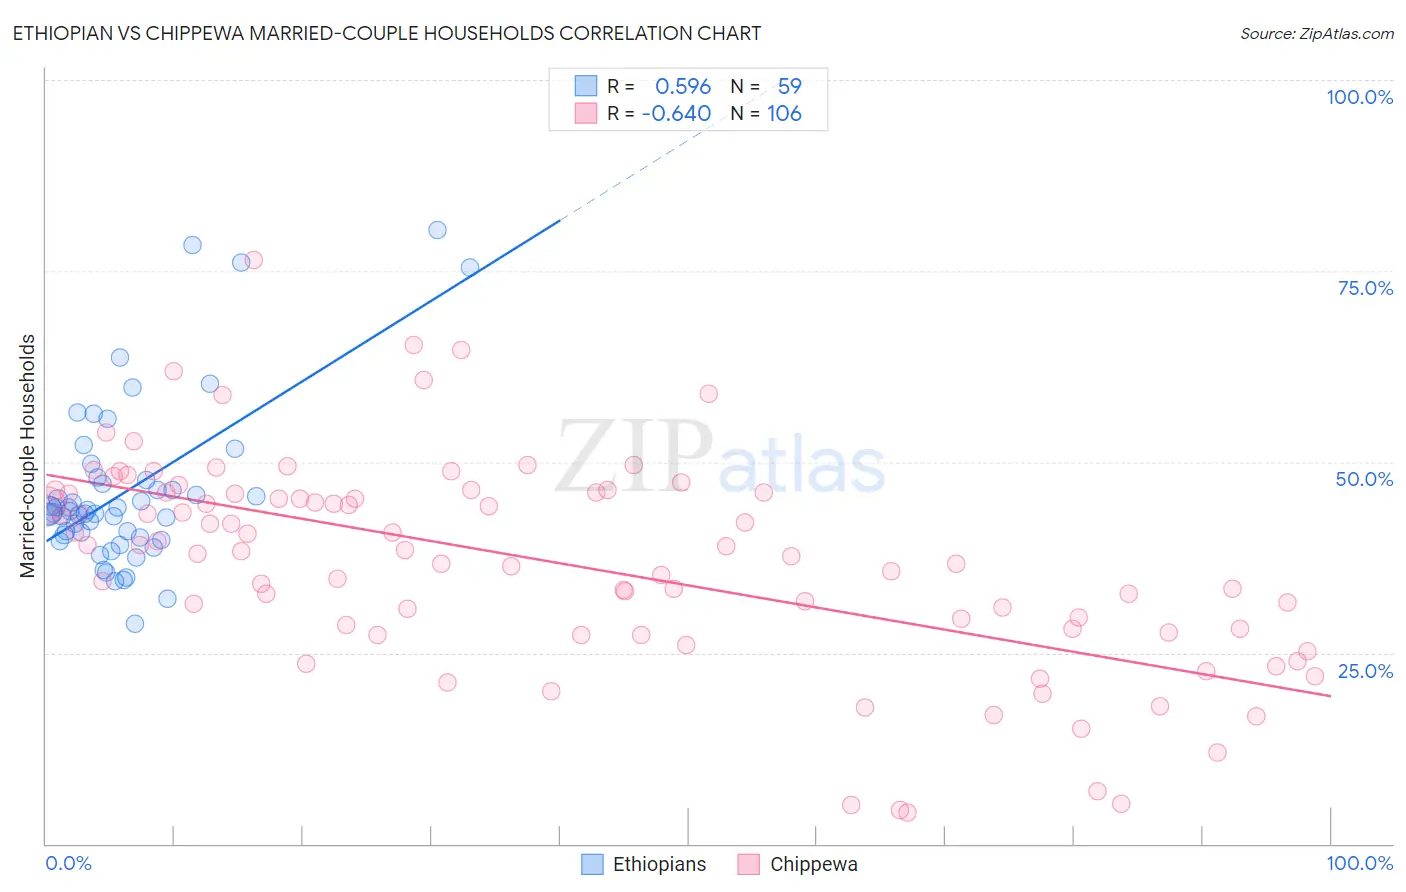
Ethiopian vs Chippewa Married-couple Households Correlation Chart
The statistical analysis conducted on geographies consisting of 223,091,132 people shows a substantial positive correlation between the proportion of Ethiopians and percentage of married-couple family households in the United States with a correlation coefficient (R) of 0.596 and weighted average of 43.2%. Similarly, the statistical analysis conducted on geographies consisting of 214,993,605 people shows a significant negative correlation between the proportion of Chippewa and percentage of married-couple family households in the United States with a correlation coefficient (R) of -0.640 and weighted average of 42.1%, a difference of 2.4%.
Married-couple Households Correlation Summary
| Measurement | Ethiopian | Chippewa |
| Minimum | 28.9% | 4.0% |
| Maximum | 80.4% | 76.5% |
| Range | 51.5% | 72.5% |
| Mean | 46.2% | 36.8% |
| Median | 43.6% | 38.4% |
| Interquartile 25% (IQ1) | 40.1% | 28.2% |
| Interquartile 75% (IQ3) | 47.7% | 45.9% |
| Interquartile Range (IQR) | 7.6% | 17.7% |
| Standard Deviation (Sample) | 10.9% | 13.8% |
| Standard Deviation (Population) | 10.8% | 13.7% |
Demographics Similar to Ethiopians and Chippewa by Married-couple Households
In terms of married-couple households, the demographic groups most similar to Ethiopians are Nigerian (43.2%, a difference of 0.010%), Immigrants from Nigeria (43.2%, a difference of 0.10%), Immigrants from Bangladesh (43.1%, a difference of 0.15%), Guatemalan (43.3%, a difference of 0.20%), and Immigrants from Ethiopia (43.1%, a difference of 0.26%). Similarly, the demographic groups most similar to Chippewa are Immigrants from Eritrea (42.1%, a difference of 0.080%), Sudanese (42.1%, a difference of 0.14%), Honduran (42.1%, a difference of 0.19%), Belizean (42.2%, a difference of 0.24%), and Ghanaian (42.2%, a difference of 0.25%).
| Demographics | Rating | Rank | Married-couple Households |
| Yuman | 0.1 /100 | #270 | Tragic 43.3% |
| Guatemalans | 0.1 /100 | #271 | Tragic 43.3% |
| Immigrants | Nigeria | 0.1 /100 | #272 | Tragic 43.2% |
| Ethiopians | 0.1 /100 | #273 | Tragic 43.2% |
| Nigerians | 0.1 /100 | #274 | Tragic 43.2% |
| Immigrants | Bangladesh | 0.0 /100 | #275 | Tragic 43.1% |
| Immigrants | Ethiopia | 0.0 /100 | #276 | Tragic 43.1% |
| Immigrants | Eastern Africa | 0.0 /100 | #277 | Tragic 42.9% |
| Immigrants | Africa | 0.0 /100 | #278 | Tragic 42.9% |
| Sierra Leoneans | 0.0 /100 | #279 | Tragic 42.9% |
| Immigrants | Ecuador | 0.0 /100 | #280 | Tragic 42.9% |
| Immigrants | Guatemala | 0.0 /100 | #281 | Tragic 42.8% |
| Bermudans | 0.0 /100 | #282 | Tragic 42.4% |
| Inupiat | 0.0 /100 | #283 | Tragic 42.4% |
| Cheyenne | 0.0 /100 | #284 | Tragic 42.3% |
| Ghanaians | 0.0 /100 | #285 | Tragic 42.2% |
| Belizeans | 0.0 /100 | #286 | Tragic 42.2% |
| Chippewa | 0.0 /100 | #287 | Tragic 42.1% |
| Immigrants | Eritrea | 0.0 /100 | #288 | Tragic 42.1% |
| Sudanese | 0.0 /100 | #289 | Tragic 42.1% |
| Hondurans | 0.0 /100 | #290 | Tragic 42.1% |