Ethiopian vs Immigrants from Guyana Married-couple Households
COMPARE
Ethiopian
Immigrants from Guyana
Married-couple Households
Married-couple Households Comparison
Ethiopians
Immigrants from Guyana
43.2%
MARRIED-COUPLE HOUSEHOLDS
0.1/ 100
METRIC RATING
273rd/ 347
METRIC RANK
41.6%
MARRIED-COUPLE HOUSEHOLDS
0.0/ 100
METRIC RATING
304th/ 347
METRIC RANK
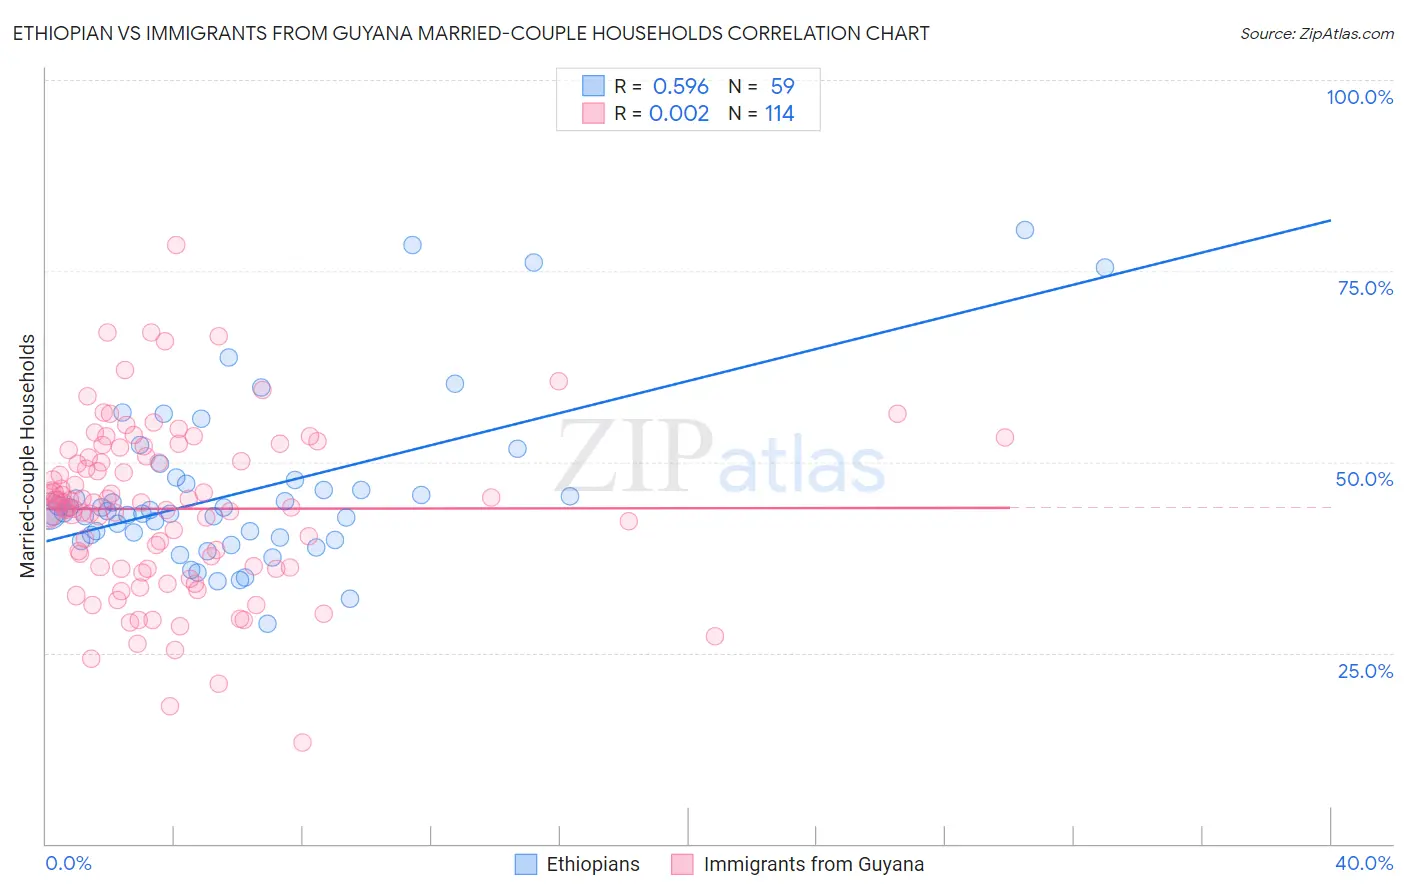
Ethiopian vs Immigrants from Guyana Married-couple Households Correlation Chart
The statistical analysis conducted on geographies consisting of 223,091,132 people shows a substantial positive correlation between the proportion of Ethiopians and percentage of married-couple family households in the United States with a correlation coefficient (R) of 0.596 and weighted average of 43.2%. Similarly, the statistical analysis conducted on geographies consisting of 183,688,079 people shows no correlation between the proportion of Immigrants from Guyana and percentage of married-couple family households in the United States with a correlation coefficient (R) of 0.002 and weighted average of 41.6%, a difference of 3.9%.
Married-couple Households Correlation Summary
| Measurement | Ethiopian | Immigrants from Guyana |
| Minimum | 28.9% | 13.3% |
| Maximum | 80.4% | 78.4% |
| Range | 51.5% | 65.2% |
| Mean | 46.2% | 43.9% |
| Median | 43.6% | 44.6% |
| Interquartile 25% (IQ1) | 40.1% | 36.2% |
| Interquartile 75% (IQ3) | 47.7% | 50.7% |
| Interquartile Range (IQR) | 7.6% | 14.5% |
| Standard Deviation (Sample) | 10.9% | 10.9% |
| Standard Deviation (Population) | 10.8% | 10.8% |
Similar Demographics by Married-couple Households
Demographics Similar to Ethiopians by Married-couple Households
In terms of married-couple households, the demographic groups most similar to Ethiopians are Nigerian (43.2%, a difference of 0.010%), Immigrants from Nigeria (43.2%, a difference of 0.10%), Immigrants from Bangladesh (43.1%, a difference of 0.15%), Guatemalan (43.3%, a difference of 0.20%), and Immigrants from Ethiopia (43.1%, a difference of 0.26%).
| Demographics | Rating | Rank | Married-couple Households |
| Ecuadorians | 0.1 /100 | #266 | Tragic 43.5% |
| Natives/Alaskans | 0.1 /100 | #267 | Tragic 43.5% |
| Immigrants | Burma/Myanmar | 0.1 /100 | #268 | Tragic 43.4% |
| Immigrants | Sierra Leone | 0.1 /100 | #269 | Tragic 43.3% |
| Yuman | 0.1 /100 | #270 | Tragic 43.3% |
| Guatemalans | 0.1 /100 | #271 | Tragic 43.3% |
| Immigrants | Nigeria | 0.1 /100 | #272 | Tragic 43.2% |
| Ethiopians | 0.1 /100 | #273 | Tragic 43.2% |
| Nigerians | 0.1 /100 | #274 | Tragic 43.2% |
| Immigrants | Bangladesh | 0.0 /100 | #275 | Tragic 43.1% |
| Immigrants | Ethiopia | 0.0 /100 | #276 | Tragic 43.1% |
| Immigrants | Eastern Africa | 0.0 /100 | #277 | Tragic 42.9% |
| Immigrants | Africa | 0.0 /100 | #278 | Tragic 42.9% |
| Sierra Leoneans | 0.0 /100 | #279 | Tragic 42.9% |
| Immigrants | Ecuador | 0.0 /100 | #280 | Tragic 42.9% |
Demographics Similar to Immigrants from Guyana by Married-couple Households
In terms of married-couple households, the demographic groups most similar to Immigrants from Guyana are Subsaharan African (41.6%, a difference of 0.11%), Sioux (41.5%, a difference of 0.11%), Immigrants from Honduras (41.6%, a difference of 0.12%), Immigrants from Bahamas (41.7%, a difference of 0.29%), and Guyanese (41.4%, a difference of 0.48%).
| Demographics | Rating | Rank | Married-couple Households |
| Arapaho | 0.0 /100 | #297 | Tragic 41.8% |
| Immigrants | Middle Africa | 0.0 /100 | #298 | Tragic 41.8% |
| Immigrants | Ghana | 0.0 /100 | #299 | Tragic 41.8% |
| Immigrants | Belize | 0.0 /100 | #300 | Tragic 41.8% |
| Immigrants | Bahamas | 0.0 /100 | #301 | Tragic 41.7% |
| Immigrants | Honduras | 0.0 /100 | #302 | Tragic 41.6% |
| Sub-Saharan Africans | 0.0 /100 | #303 | Tragic 41.6% |
| Immigrants | Guyana | 0.0 /100 | #304 | Tragic 41.6% |
| Sioux | 0.0 /100 | #305 | Tragic 41.5% |
| Guyanese | 0.0 /100 | #306 | Tragic 41.4% |
| Immigrants | Western Africa | 0.0 /100 | #307 | Tragic 41.4% |
| Crow | 0.0 /100 | #308 | Tragic 41.4% |
| Immigrants | Trinidad and Tobago | 0.0 /100 | #309 | Tragic 41.2% |
| Haitians | 0.0 /100 | #310 | Tragic 41.2% |
| Colville | 0.0 /100 | #311 | Tragic 41.0% |