Ethiopian vs Australian Married-couple Households
COMPARE
Ethiopian
Australian
Married-couple Households
Married-couple Households Comparison
Ethiopians
Australians
43.2%
MARRIED-COUPLE HOUSEHOLDS
0.1/ 100
METRIC RATING
273rd/ 347
METRIC RANK
47.4%
MARRIED-COUPLE HOUSEHOLDS
89.0/ 100
METRIC RATING
125th/ 347
METRIC RANK
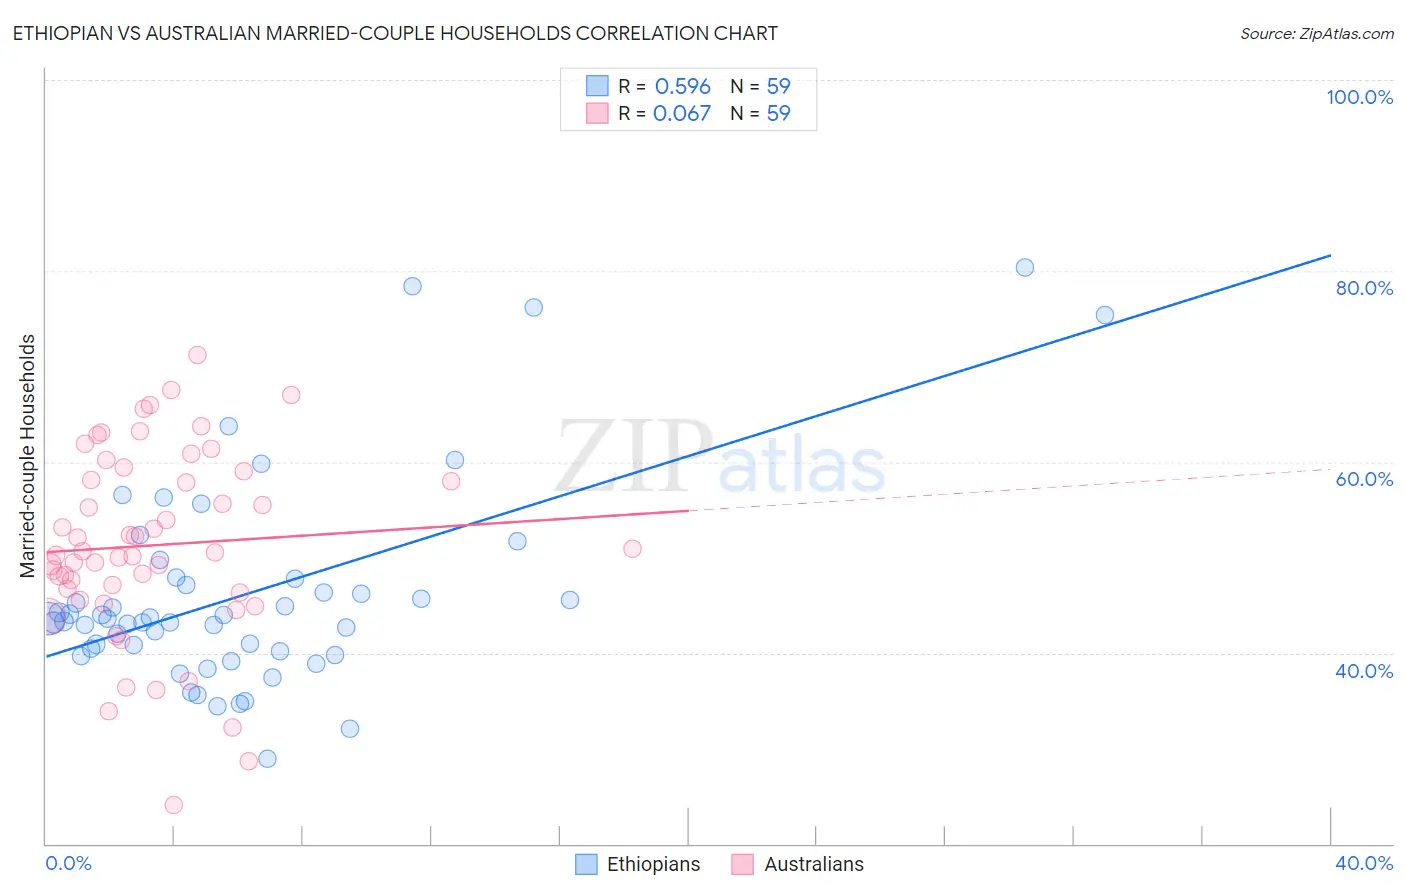
Ethiopian vs Australian Married-couple Households Correlation Chart
The statistical analysis conducted on geographies consisting of 223,091,132 people shows a substantial positive correlation between the proportion of Ethiopians and percentage of married-couple family households in the United States with a correlation coefficient (R) of 0.596 and weighted average of 43.2%. Similarly, the statistical analysis conducted on geographies consisting of 224,029,086 people shows a slight positive correlation between the proportion of Australians and percentage of married-couple family households in the United States with a correlation coefficient (R) of 0.067 and weighted average of 47.4%, a difference of 9.7%.
Married-couple Households Correlation Summary
| Measurement | Ethiopian | Australian |
| Minimum | 28.9% | 24.0% |
| Maximum | 80.4% | 71.2% |
| Range | 51.5% | 47.2% |
| Mean | 46.2% | 51.3% |
| Median | 43.6% | 50.6% |
| Interquartile 25% (IQ1) | 40.1% | 46.3% |
| Interquartile 75% (IQ3) | 47.7% | 59.0% |
| Interquartile Range (IQR) | 7.6% | 12.7% |
| Standard Deviation (Sample) | 10.9% | 9.9% |
| Standard Deviation (Population) | 10.8% | 9.9% |
Similar Demographics by Married-couple Households
Demographics Similar to Ethiopians by Married-couple Households
In terms of married-couple households, the demographic groups most similar to Ethiopians are Nigerian (43.2%, a difference of 0.010%), Immigrants from Nigeria (43.2%, a difference of 0.10%), Immigrants from Bangladesh (43.1%, a difference of 0.15%), Guatemalan (43.3%, a difference of 0.20%), and Immigrants from Ethiopia (43.1%, a difference of 0.26%).
| Demographics | Rating | Rank | Married-couple Households |
| Ecuadorians | 0.1 /100 | #266 | Tragic 43.5% |
| Natives/Alaskans | 0.1 /100 | #267 | Tragic 43.5% |
| Immigrants | Burma/Myanmar | 0.1 /100 | #268 | Tragic 43.4% |
| Immigrants | Sierra Leone | 0.1 /100 | #269 | Tragic 43.3% |
| Yuman | 0.1 /100 | #270 | Tragic 43.3% |
| Guatemalans | 0.1 /100 | #271 | Tragic 43.3% |
| Immigrants | Nigeria | 0.1 /100 | #272 | Tragic 43.2% |
| Ethiopians | 0.1 /100 | #273 | Tragic 43.2% |
| Nigerians | 0.1 /100 | #274 | Tragic 43.2% |
| Immigrants | Bangladesh | 0.0 /100 | #275 | Tragic 43.1% |
| Immigrants | Ethiopia | 0.0 /100 | #276 | Tragic 43.1% |
| Immigrants | Eastern Africa | 0.0 /100 | #277 | Tragic 42.9% |
| Immigrants | Africa | 0.0 /100 | #278 | Tragic 42.9% |
| Sierra Leoneans | 0.0 /100 | #279 | Tragic 42.9% |
| Immigrants | Ecuador | 0.0 /100 | #280 | Tragic 42.9% |
Demographics Similar to Australians by Married-couple Households
In terms of married-couple households, the demographic groups most similar to Australians are Zimbabwean (47.4%, a difference of 0.020%), Immigrants from Venezuela (47.4%, a difference of 0.030%), Pakistani (47.3%, a difference of 0.030%), Celtic (47.3%, a difference of 0.080%), and Immigrants from Peru (47.3%, a difference of 0.10%).
| Demographics | Rating | Rank | Married-couple Households |
| Immigrants | Germany | 92.4 /100 | #118 | Exceptional 47.5% |
| Chileans | 92.2 /100 | #119 | Exceptional 47.5% |
| Puget Sound Salish | 90.5 /100 | #120 | Exceptional 47.4% |
| Immigrants | Eastern Europe | 90.3 /100 | #121 | Exceptional 47.4% |
| Okinawans | 90.1 /100 | #122 | Exceptional 47.4% |
| Immigrants | Venezuela | 89.3 /100 | #123 | Excellent 47.4% |
| Zimbabweans | 89.2 /100 | #124 | Excellent 47.4% |
| Australians | 89.0 /100 | #125 | Excellent 47.4% |
| Pakistanis | 88.6 /100 | #126 | Excellent 47.3% |
| Celtics | 88.1 /100 | #127 | Excellent 47.3% |
| Immigrants | Peru | 87.9 /100 | #128 | Excellent 47.3% |
| Immigrants | Iraq | 87.8 /100 | #129 | Excellent 47.3% |
| Immigrants | Hungary | 87.8 /100 | #130 | Excellent 47.3% |
| Immigrants | Denmark | 87.5 /100 | #131 | Excellent 47.3% |
| Immigrants | Ukraine | 86.7 /100 | #132 | Excellent 47.3% |