Swedish GED/Equivalency
COMPARE
Swedish
Select to Compare
GED/Equivalency
Swedish GED/Equivalency
88.8%
GED/EQUIVALENCY
99.9/ 100
METRIC RATING
19th/ 347
METRIC RANK
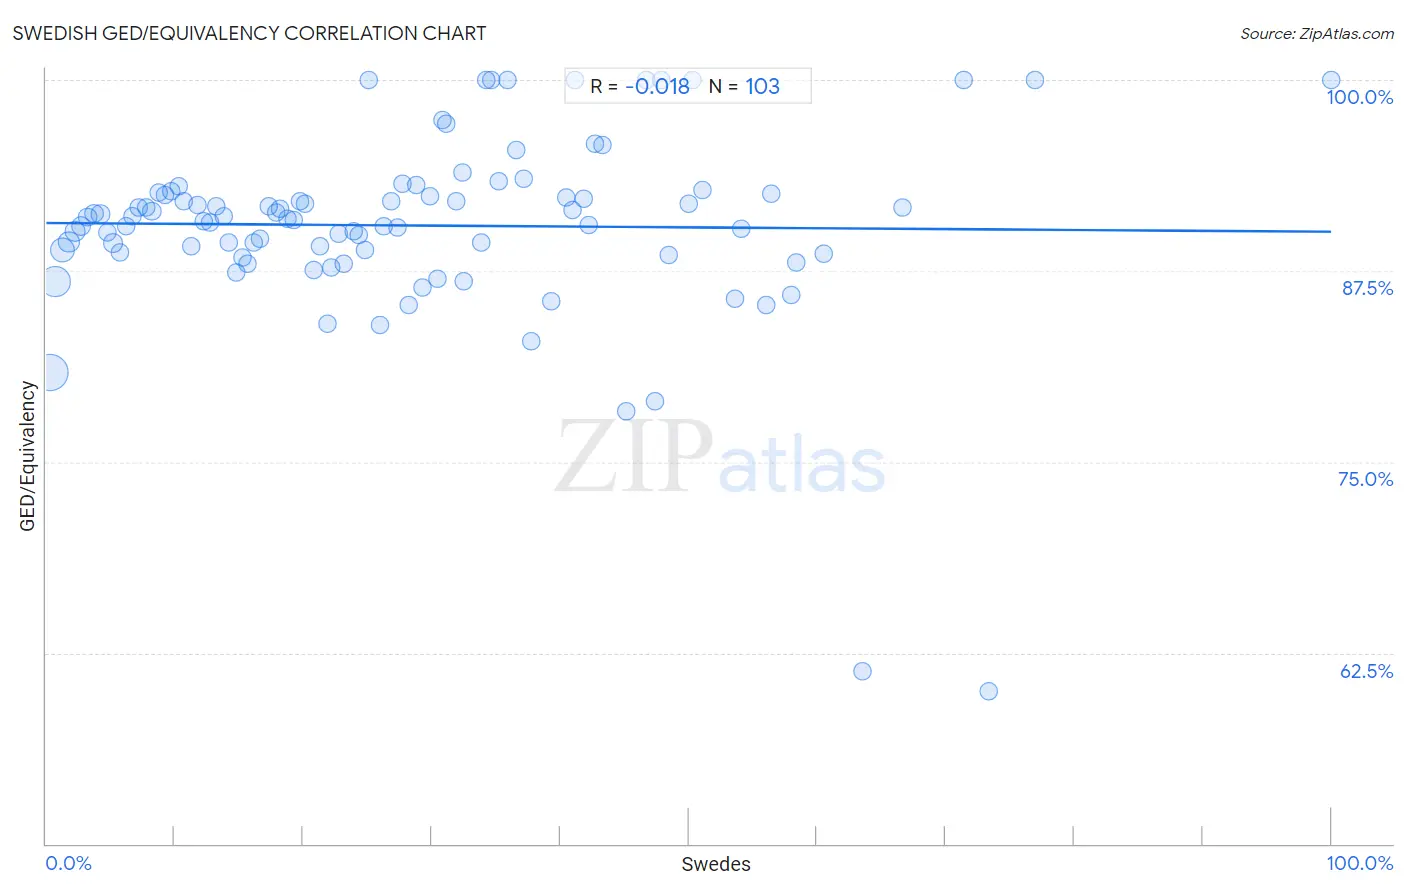
Swedish GED/Equivalency Correlation Chart
The statistical analysis conducted on geographies consisting of 539,231,677 people shows no correlation between the proportion of Swedes and percentage of population with at least ged/equivalency education in the United States with a correlation coefficient (R) of -0.018 and weighted average of 88.8%. On average, for every 1% (one percent) increase in Swedes within a typical geography, there is a decrease of 0.0057% in percentage of population with at least ged/equivalency education.
It is essential to understand that the correlation between the percentage of Swedes and percentage of population with at least ged/equivalency education does not imply a direct cause-and-effect relationship. It remains uncertain whether the presence of Swedes influences an upward or downward trend in the level of percentage of population with at least ged/equivalency education within an area, or if Swedes simply ended up residing in those areas with higher or lower levels of percentage of population with at least ged/equivalency education due to other factors.
Demographics Similar to Swedes by GED/Equivalency
In terms of ged/equivalency, the demographic groups most similar to Swedes are Slovene (88.8%, a difference of 0.050%), Croatian (88.8%, a difference of 0.080%), Immigrants from Taiwan (88.8%, a difference of 0.11%), Okinawan (88.9%, a difference of 0.14%), and Maltese (88.6%, a difference of 0.15%).
| Demographics | Rating | Rank | GED/Equivalency |
| Lithuanians | 99.9 /100 | #12 | Exceptional 88.9% |
| Immigrants from Iran | 99.9 /100 | #13 | Exceptional 88.9% |
| Cypriots | 99.9 /100 | #14 | Exceptional 88.9% |
| Okinawans | 99.9 /100 | #15 | Exceptional 88.9% |
| Immigrants from Taiwan | 99.9 /100 | #16 | Exceptional 88.8% |
| Croatians | 99.9 /100 | #17 | Exceptional 88.8% |
| Slovenes | 99.9 /100 | #18 | Exceptional 88.8% |
| Swedes | 99.9 /100 | #19 | Exceptional 88.8% |
| Maltese | 99.9 /100 | #20 | Exceptional 88.6% |
| Luxembourgers | 99.8 /100 | #21 | Exceptional 88.6% |
| Immigrants from Ireland | 99.8 /100 | #22 | Exceptional 88.6% |
| Russians | 99.8 /100 | #23 | Exceptional 88.6% |
| Slovaks | 99.8 /100 | #24 | Exceptional 88.6% |
| Estonians | 99.8 /100 | #25 | Exceptional 88.6% |
| Immigrants from Australia | 99.8 /100 | #26 | Exceptional 88.6% |
Swedish GED/Equivalency Correlation Summary
| Measurement | Swedish Data | GED/Equivalency Data |
| Minimum | 0.26% | 60.0% |
| Maximum | 100.0% | 100.0% |
| Range | 99.7% | 40.0% |
| Mean | 28.6% | 90.5% |
| Median | 25.9% | 90.9% |
| Interquartile 25% (IQ1) | 12.7% | 88.6% |
| Interquartile 75% (IQ3) | 41.2% | 92.6% |
| Interquartile Range (IQR) | 28.4% | 4.0% |
| Standard Deviation (Sample) | 19.8% | 6.1% |
| Standard Deviation (Population) | 19.7% | 6.1% |
Correlation Details
| Swedish Percentile | Sample Size | GED/Equivalency |
[ 0.0% - 0.5% ] 0.26% | 211,679,391 | 80.8% |
[ 0.5% - 1.0% ] 0.73% | 134,473,928 | 86.8% |
[ 1.0% - 1.5% ] 1.22% | 71,417,441 | 88.9% |
[ 1.5% - 2.0% ] 1.73% | 39,889,966 | 89.4% |
[ 2.0% - 2.5% ] 2.23% | 26,115,588 | 90.1% |
[ 2.5% - 3.0% ] 2.72% | 18,027,356 | 90.4% |
[ 3.0% - 3.5% ] 3.23% | 10,714,706 | 91.0% |
[ 3.5% - 4.0% ] 3.72% | 7,263,654 | 91.3% |
[ 4.0% - 4.5% ] 4.22% | 3,617,262 | 91.2% |
[ 4.5% - 5.0% ] 4.76% | 2,540,679 | 90.0% |
[ 5.0% - 5.5% ] 5.20% | 2,237,968 | 89.3% |
[ 5.5% - 6.0% ] 5.77% | 1,698,191 | 88.7% |
[ 6.0% - 6.5% ] 6.22% | 2,040,787 | 90.4% |
[ 6.5% - 7.0% ] 6.71% | 1,240,540 | 91.1% |
[ 7.0% - 7.5% ] 7.24% | 927,855 | 91.6% |
[ 7.5% - 8.0% ] 7.77% | 1,137,457 | 91.6% |
[ 8.0% - 8.5% ] 8.22% | 729,573 | 91.4% |
[ 8.5% - 9.0% ] 8.75% | 616,205 | 92.6% |
[ 9.0% - 9.5% ] 9.23% | 544,886 | 92.5% |
[ 9.5% - 10.0% ] 9.72% | 529,016 | 92.7% |
[ 10.0% - 10.5% ] 10.28% | 300,252 | 93.0% |
[ 10.5% - 11.0% ] 10.71% | 166,401 | 92.0% |
[ 11.0% - 11.5% ] 11.24% | 229,027 | 89.1% |
[ 11.5% - 12.0% ] 11.77% | 102,999 | 91.8% |
[ 12.0% - 12.5% ] 12.25% | 144,041 | 90.8% |
[ 12.5% - 13.0% ] 12.74% | 150,831 | 90.7% |
[ 13.0% - 13.5% ] 13.21% | 138,891 | 91.7% |
[ 13.5% - 14.0% ] 13.78% | 93,095 | 91.1% |
[ 14.0% - 14.5% ] 14.18% | 51,784 | 89.3% |
[ 14.5% - 15.0% ] 14.77% | 57,285 | 87.4% |
[ 15.0% - 15.5% ] 15.27% | 59,093 | 88.4% |
[ 15.5% - 16.0% ] 15.67% | 26,860 | 88.0% |
[ 16.0% - 16.5% ] 16.18% | 38,766 | 89.4% |
[ 16.5% - 17.0% ] 16.60% | 44,784 | 89.6% |
[ 17.0% - 17.5% ] 17.30% | 19,193 | 91.7% |
[ 17.5% - 18.0% ] 17.85% | 27,729 | 91.3% |
[ 18.0% - 18.5% ] 18.20% | 10,828 | 91.5% |
[ 18.5% - 19.0% ] 18.78% | 5,725 | 90.9% |
[ 19.0% - 19.5% ] 19.31% | 15,679 | 90.9% |
[ 19.5% - 20.0% ] 19.78% | 16,222 | 92.1% |
[ 20.0% - 20.5% ] 20.18% | 16,708 | 91.9% |
[ 20.5% - 21.0% ] 20.78% | 4,937 | 87.5% |
[ 21.0% - 21.5% ] 21.30% | 2,423 | 89.1% |
[ 21.5% - 22.0% ] 21.93% | 4,077 | 84.1% |
[ 22.0% - 22.5% ] 22.19% | 2,307 | 87.7% |
[ 22.5% - 23.0% ] 22.74% | 4,023 | 90.0% |
[ 23.0% - 23.5% ] 23.16% | 6,033 | 87.9% |
[ 23.5% - 24.0% ] 23.90% | 2,757 | 90.1% |
[ 24.0% - 24.5% ] 24.33% | 3,819 | 89.9% |
[ 24.5% - 25.0% ] 24.77% | 4,683 | 88.9% |
[ 25.0% - 25.5% ] 25.13% | 199 | 100.0% |
[ 25.5% - 26.0% ] 25.93% | 4,257 | 83.9% |
[ 26.0% - 26.5% ] 26.23% | 3,835 | 90.4% |
[ 26.5% - 27.0% ] 26.81% | 2,331 | 92.1% |
[ 27.0% - 27.5% ] 27.35% | 2,600 | 90.4% |
[ 27.5% - 28.0% ] 27.74% | 1,896 | 93.2% |
[ 28.0% - 28.5% ] 28.16% | 1,818 | 85.3% |
[ 28.5% - 29.0% ] 28.79% | 3,001 | 93.1% |
[ 29.0% - 29.5% ] 29.24% | 872 | 86.4% |
[ 29.5% - 30.0% ] 29.86% | 2,880 | 92.4% |
[ 30.0% - 30.5% ] 30.43% | 23 | 87.0% |
[ 30.5% - 31.0% ] 30.80% | 289 | 97.4% |
[ 31.0% - 31.5% ] 31.09% | 386 | 97.1% |
[ 31.5% - 32.0% ] 31.89% | 1,251 | 92.0% |
[ 32.0% - 32.5% ] 32.43% | 370 | 93.9% |
[ 32.5% - 33.0% ] 32.52% | 1,891 | 86.8% |
[ 33.5% - 34.0% ] 33.82% | 479 | 89.4% |
[ 34.0% - 34.5% ] 34.21% | 38 | 100.0% |
[ 34.5% - 35.0% ] 34.62% | 26 | 100.0% |
[ 35.0% - 35.5% ] 35.18% | 506 | 93.3% |
[ 35.5% - 36.0% ] 35.85% | 53 | 100.0% |
[ 36.5% - 37.0% ] 36.56% | 424 | 95.4% |
[ 37.0% - 37.5% ] 37.20% | 1,683 | 93.5% |
[ 37.5% - 38.0% ] 37.75% | 408 | 82.9% |
[ 39.0% - 39.5% ] 39.33% | 150 | 85.5% |
[ 40.0% - 40.5% ] 40.43% | 507 | 92.3% |
[ 40.5% - 41.0% ] 40.92% | 325 | 91.5% |
[ 41.0% - 41.5% ] 41.18% | 34 | 100.0% |
[ 41.5% - 42.0% ] 41.86% | 258 | 92.2% |
[ 42.0% - 42.5% ] 42.19% | 429 | 90.5% |
[ 42.5% - 43.0% ] 42.69% | 616 | 95.8% |
[ 43.0% - 43.5% ] 43.26% | 141 | 95.7% |
[ 45.0% - 45.5% ] 45.12% | 461 | 78.3% |
[ 46.5% - 47.0% ] 46.67% | 30 | 100.0% |
[ 47.0% - 47.5% ] 47.37% | 19 | 78.9% |
[ 47.5% - 48.0% ] 47.83% | 69 | 100.0% |
[ 48.0% - 48.5% ] 48.40% | 374 | 88.6% |
[ 50.0% - 50.5% ] 50.00% | 284 | 91.9% |
[ 50.0% - 50.5% ] 50.28% | 177 | 100.0% |
[ 51.0% - 51.5% ] 51.11% | 180 | 92.8% |
[ 53.5% - 54.0% ] 53.57% | 28 | 85.7% |
[ 54.0% - 54.5% ] 54.05% | 346 | 90.3% |
[ 55.5% - 56.0% ] 55.99% | 434 | 85.3% |
[ 56.0% - 56.5% ] 56.39% | 133 | 92.6% |
[ 57.5% - 58.0% ] 57.97% | 276 | 85.9% |
[ 58.0% - 58.5% ] 58.33% | 564 | 88.0% |
[ 60.5% - 61.0% ] 60.53% | 114 | 88.6% |
[ 63.5% - 64.0% ] 63.56% | 225 | 61.3% |
[ 66.5% - 67.0% ] 66.67% | 12 | 91.7% |
[ 71.0% - 71.5% ] 71.43% | 70 | 100.0% |
[ 73.0% - 73.5% ] 73.33% | 15 | 60.0% |
[ 76.5% - 77.0% ] 76.92% | 52 | 100.0% |
[ 99.5% - 100.0% ] 100.00% | 137 | 100.0% |