Mexican GED/Equivalency
COMPARE
Mexican
Select to Compare
GED/Equivalency
Mexican GED/Equivalency
77.4%
GED/EQUIVALENCY
0.0/ 100
METRIC RATING
341st/ 347
METRIC RANK
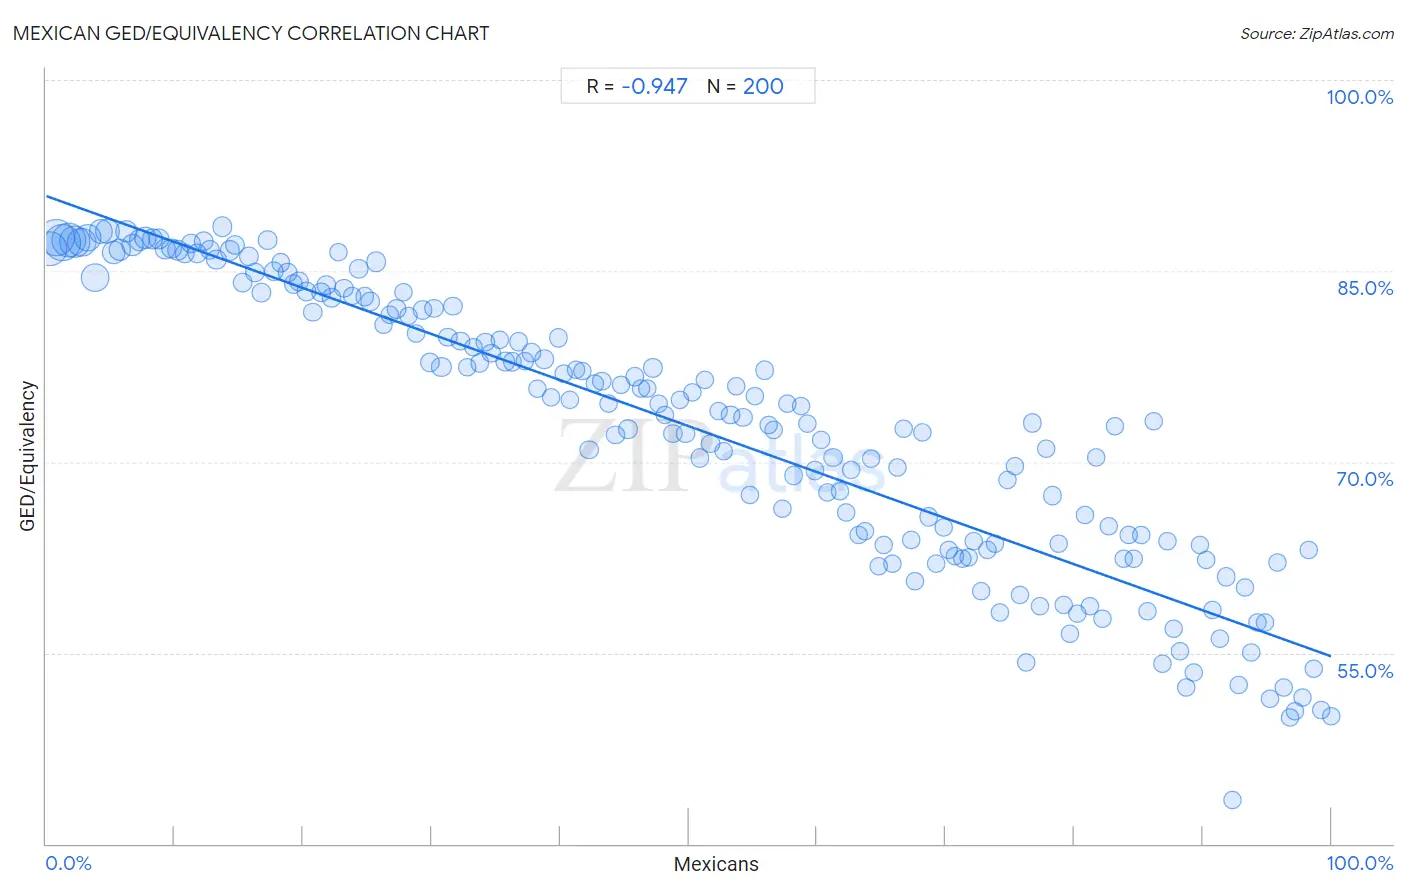
Mexican GED/Equivalency Correlation Chart
The statistical analysis conducted on geographies consisting of 565,337,088 people shows a near-perfect negative correlation between the proportion of Mexicans and percentage of population with at least ged/equivalency education in the United States with a correlation coefficient (R) of -0.947 and weighted average of 77.4%. On average, for every 1% (one percent) increase in Mexicans within a typical geography, there is a decrease of 0.36% in percentage of population with at least ged/equivalency education.
It is essential to understand that the correlation between the percentage of Mexicans and percentage of population with at least ged/equivalency education does not imply a direct cause-and-effect relationship. It remains uncertain whether the presence of Mexicans influences an upward or downward trend in the level of percentage of population with at least ged/equivalency education within an area, or if Mexicans simply ended up residing in those areas with higher or lower levels of percentage of population with at least ged/equivalency education due to other factors.
Demographics Similar to Mexicans by GED/Equivalency
In terms of ged/equivalency, the demographic groups most similar to Mexicans are Tohono O'odham (77.5%, a difference of 0.090%), Immigrants from El Salvador (77.6%, a difference of 0.24%), Immigrants from Guatemala (77.9%, a difference of 0.63%), Immigrants from Yemen (77.9%, a difference of 0.65%), and Immigrants from Dominican Republic (78.0%, a difference of 0.71%).
| Demographics | Rating | Rank | GED/Equivalency |
| Salvadorans | 0.0 /100 | #333 | Tragic 78.6% |
| Guatemalans | 0.0 /100 | #334 | Tragic 78.5% |
| Immigrants from Latin America | 0.0 /100 | #335 | Tragic 78.5% |
| Immigrants from Dominican Republic | 0.0 /100 | #336 | Tragic 78.0% |
| Immigrants from Yemen | 0.0 /100 | #337 | Tragic 77.9% |
| Immigrants from Guatemala | 0.0 /100 | #338 | Tragic 77.9% |
| Immigrants from El Salvador | 0.0 /100 | #339 | Tragic 77.6% |
| Tohono O'odham | 0.0 /100 | #340 | Tragic 77.5% |
| Mexicans | 0.0 /100 | #341 | Tragic 77.4% |
| Pima | 0.0 /100 | #342 | Tragic 76.4% |
| Immigrants from Central America | 0.0 /100 | #343 | Tragic 76.4% |
| Spanish American Indians | 0.0 /100 | #344 | Tragic 76.3% |
| Immigrants from Mexico | 0.0 /100 | #345 | Tragic 75.7% |
| Houma | 0.0 /100 | #346 | Tragic 75.0% |
| Yakama | 0.0 /100 | #347 | Tragic 74.5% |
Mexican GED/Equivalency Correlation Summary
| Measurement | Mexican Data | GED/Equivalency Data |
| Minimum | 0.28% | 43.4% |
| Maximum | 100.0% | 88.5% |
| Range | 99.7% | 45.1% |
| Mean | 50.0% | 72.8% |
| Median | 50.0% | 74.5% |
| Interquartile 25% (IQ1) | 25.0% | 63.6% |
| Interquartile 75% (IQ3) | 75.1% | 83.0% |
| Interquartile Range (IQR) | 50.0% | 19.4% |
| Standard Deviation (Sample) | 28.9% | 11.1% |
| Standard Deviation (Population) | 28.9% | 11.0% |
Correlation Details
| Mexican Percentile | Sample Size | GED/Equivalency |
[ 0.0% - 0.5% ] 0.28% | 40,177,202 | 86.8% |
[ 0.5% - 1.0% ] 0.75% | 45,691,262 | 87.6% |
[ 1.0% - 1.5% ] 1.25% | 46,167,078 | 87.2% |
[ 1.5% - 2.0% ] 1.75% | 39,791,001 | 87.4% |
[ 2.0% - 2.5% ] 2.23% | 31,725,406 | 87.3% |
[ 2.5% - 3.0% ] 2.74% | 25,665,142 | 87.2% |
[ 3.0% - 3.5% ] 3.23% | 20,321,145 | 87.6% |
[ 3.5% - 4.0% ] 3.81% | 24,077,605 | 84.4% |
[ 4.0% - 4.5% ] 4.26% | 14,409,214 | 88.1% |
[ 4.5% - 5.0% ] 4.75% | 15,397,453 | 88.1% |
[ 5.0% - 5.5% ] 5.26% | 12,622,675 | 86.4% |
[ 5.5% - 6.0% ] 5.74% | 10,209,426 | 86.7% |
[ 6.0% - 6.5% ] 6.27% | 8,805,255 | 88.1% |
[ 6.5% - 7.0% ] 6.76% | 9,109,856 | 87.0% |
[ 7.0% - 7.5% ] 7.26% | 8,482,161 | 87.5% |
[ 7.5% - 8.0% ] 7.72% | 7,545,446 | 87.6% |
[ 8.0% - 8.5% ] 8.25% | 5,513,174 | 87.5% |
[ 8.5% - 9.0% ] 8.75% | 5,278,413 | 87.5% |
[ 9.0% - 9.5% ] 9.24% | 5,055,513 | 86.7% |
[ 9.5% - 10.0% ] 9.73% | 4,450,844 | 86.8% |
[ 10.0% - 10.5% ] 10.24% | 5,120,313 | 86.6% |
[ 10.5% - 11.0% ] 10.77% | 4,417,272 | 86.4% |
[ 11.0% - 11.5% ] 11.26% | 4,393,668 | 87.2% |
[ 11.5% - 12.0% ] 11.76% | 4,645,357 | 86.4% |
[ 12.0% - 12.5% ] 12.24% | 3,483,166 | 87.3% |
[ 12.5% - 13.0% ] 12.72% | 4,043,129 | 86.6% |
[ 13.0% - 13.5% ] 13.27% | 5,166,927 | 85.9% |
[ 13.5% - 14.0% ] 13.73% | 3,998,421 | 88.5% |
[ 14.0% - 14.5% ] 14.25% | 3,767,765 | 86.6% |
[ 14.5% - 15.0% ] 14.73% | 3,217,359 | 87.1% |
[ 15.0% - 15.5% ] 15.26% | 2,449,311 | 84.1% |
[ 15.5% - 16.0% ] 15.76% | 2,371,991 | 86.1% |
[ 16.0% - 16.5% ] 16.23% | 3,328,386 | 84.9% |
[ 16.5% - 17.0% ] 16.75% | 2,510,366 | 83.3% |
[ 17.0% - 17.5% ] 17.24% | 2,589,622 | 87.4% |
[ 17.5% - 18.0% ] 17.73% | 3,075,618 | 84.9% |
[ 18.0% - 18.5% ] 18.25% | 2,236,347 | 85.6% |
[ 18.5% - 19.0% ] 18.76% | 2,444,900 | 84.8% |
[ 19.0% - 19.5% ] 19.25% | 1,526,593 | 84.0% |
[ 19.5% - 20.0% ] 19.69% | 2,232,603 | 84.2% |
[ 20.0% - 20.5% ] 20.24% | 2,031,278 | 83.4% |
[ 20.5% - 21.0% ] 20.75% | 1,620,350 | 81.8% |
[ 21.0% - 21.5% ] 21.35% | 3,916,934 | 83.3% |
[ 21.5% - 22.0% ] 21.78% | 2,586,201 | 83.9% |
[ 22.0% - 22.5% ] 22.20% | 1,917,943 | 82.9% |
[ 22.5% - 23.0% ] 22.74% | 1,512,719 | 86.5% |
[ 23.0% - 23.5% ] 23.18% | 2,287,414 | 83.6% |
[ 23.5% - 24.0% ] 23.79% | 1,512,533 | 83.0% |
[ 24.0% - 24.5% ] 24.29% | 2,984,365 | 85.2% |
[ 24.5% - 25.0% ] 24.77% | 1,333,655 | 83.0% |
[ 25.0% - 25.5% ] 25.24% | 1,955,302 | 82.6% |
[ 25.5% - 26.0% ] 25.66% | 3,592,059 | 85.7% |
[ 26.0% - 26.5% ] 26.22% | 1,266,208 | 80.8% |
[ 26.5% - 27.0% ] 26.73% | 1,326,662 | 81.5% |
[ 27.0% - 27.5% ] 27.24% | 1,663,662 | 82.0% |
[ 27.5% - 28.0% ] 27.81% | 1,431,206 | 83.3% |
[ 28.0% - 28.5% ] 28.19% | 1,425,815 | 81.5% |
[ 28.5% - 29.0% ] 28.76% | 1,211,015 | 80.1% |
[ 29.0% - 29.5% ] 29.30% | 3,003,180 | 82.0% |
[ 29.5% - 30.0% ] 29.85% | 3,386,395 | 77.8% |
[ 30.0% - 30.5% ] 30.19% | 1,866,289 | 82.1% |
[ 30.5% - 31.0% ] 30.78% | 5,515,585 | 77.5% |
[ 31.0% - 31.5% ] 31.27% | 1,409,835 | 79.8% |
[ 31.5% - 32.0% ] 31.66% | 609,183 | 82.2% |
[ 32.0% - 32.5% ] 32.22% | 892,495 | 79.5% |
[ 32.5% - 33.0% ] 32.75% | 1,314,403 | 77.4% |
[ 33.0% - 33.5% ] 33.23% | 1,403,350 | 79.0% |
[ 33.5% - 34.0% ] 33.74% | 1,169,173 | 77.8% |
[ 34.0% - 34.5% ] 34.19% | 1,410,545 | 79.4% |
[ 34.5% - 35.0% ] 34.64% | 2,498,405 | 78.5% |
[ 35.0% - 35.5% ] 35.30% | 999,908 | 79.6% |
[ 35.5% - 36.0% ] 35.72% | 1,590,032 | 77.9% |
[ 36.0% - 36.5% ] 36.24% | 532,828 | 77.9% |
[ 36.5% - 37.0% ] 36.73% | 929,370 | 79.4% |
[ 37.0% - 37.5% ] 37.24% | 819,783 | 77.9% |
[ 37.5% - 38.0% ] 37.74% | 2,443,240 | 78.6% |
[ 38.0% - 38.5% ] 38.20% | 402,941 | 75.8% |
[ 38.5% - 39.0% ] 38.76% | 762,186 | 78.1% |
[ 39.0% - 39.5% ] 39.26% | 747,331 | 75.1% |
[ 39.5% - 40.0% ] 39.85% | 1,540,138 | 79.8% |
[ 40.0% - 40.5% ] 40.24% | 687,361 | 77.0% |
[ 40.5% - 41.0% ] 40.78% | 739,237 | 74.9% |
[ 41.0% - 41.5% ] 41.25% | 1,103,994 | 77.3% |
[ 41.5% - 42.0% ] 41.73% | 806,799 | 77.1% |
[ 42.0% - 42.5% ] 42.24% | 1,001,409 | 70.9% |
[ 42.5% - 43.0% ] 42.73% | 652,400 | 76.1% |
[ 43.0% - 43.5% ] 43.23% | 496,212 | 76.4% |
[ 43.5% - 44.0% ] 43.73% | 961,247 | 74.5% |
[ 44.0% - 44.5% ] 44.30% | 633,963 | 72.1% |
[ 44.5% - 45.0% ] 44.74% | 890,043 | 76.0% |
[ 45.0% - 45.5% ] 45.26% | 731,450 | 72.6% |
[ 45.5% - 46.0% ] 45.77% | 871,938 | 76.7% |
[ 46.0% - 46.5% ] 46.29% | 1,150,228 | 75.8% |
[ 46.5% - 47.0% ] 46.78% | 990,815 | 75.8% |
[ 47.0% - 47.5% ] 47.20% | 1,121,870 | 77.4% |
[ 47.5% - 48.0% ] 47.66% | 218,790 | 74.5% |
[ 48.0% - 48.5% ] 48.16% | 518,776 | 73.7% |
[ 48.5% - 49.0% ] 48.77% | 889,766 | 72.2% |
[ 49.0% - 49.5% ] 49.29% | 493,661 | 74.9% |
[ 49.5% - 50.0% ] 49.75% | 547,285 | 72.2% |
[ 50.0% - 50.5% ] 50.28% | 703,504 | 75.5% |
[ 50.5% - 51.0% ] 50.85% | 684,212 | 70.3% |
[ 51.0% - 51.5% ] 51.29% | 674,174 | 76.4% |
[ 51.5% - 52.0% ] 51.70% | 312,914 | 71.4% |
[ 52.0% - 52.5% ] 52.34% | 673,430 | 74.0% |
[ 52.5% - 53.0% ] 52.71% | 522,549 | 70.8% |
[ 53.0% - 53.5% ] 53.25% | 330,194 | 73.7% |
[ 53.5% - 54.0% ] 53.69% | 128,996 | 76.0% |
[ 54.0% - 54.5% ] 54.23% | 507,102 | 73.5% |
[ 54.5% - 55.0% ] 54.80% | 356,753 | 67.4% |
[ 55.0% - 55.5% ] 55.16% | 792,573 | 75.2% |
[ 55.5% - 56.0% ] 55.92% | 1,730,904 | 77.2% |
[ 56.0% - 56.5% ] 56.21% | 290,875 | 72.9% |
[ 56.5% - 57.0% ] 56.65% | 408,380 | 72.5% |
[ 57.0% - 57.5% ] 57.31% | 392,992 | 66.3% |
[ 57.5% - 58.0% ] 57.69% | 573,497 | 74.6% |
[ 58.0% - 58.5% ] 58.19% | 726,723 | 68.9% |
[ 58.5% - 59.0% ] 58.76% | 834,048 | 74.4% |
[ 59.0% - 59.5% ] 59.24% | 527,415 | 73.0% |
[ 59.5% - 60.0% ] 59.79% | 424,689 | 69.3% |
[ 60.0% - 60.5% ] 60.32% | 408,822 | 71.7% |
[ 60.5% - 61.0% ] 60.76% | 476,150 | 67.6% |
[ 61.0% - 61.5% ] 61.23% | 281,769 | 70.4% |
[ 61.5% - 62.0% ] 61.76% | 217,662 | 67.7% |
[ 62.0% - 62.5% ] 62.26% | 270,013 | 66.0% |
[ 62.5% - 63.0% ] 62.63% | 449,820 | 69.4% |
[ 63.0% - 63.5% ] 63.21% | 305,179 | 64.3% |
[ 63.5% - 64.0% ] 63.73% | 195,267 | 64.5% |
[ 64.0% - 64.5% ] 64.15% | 567,789 | 70.2% |
[ 64.5% - 65.0% ] 64.82% | 168,536 | 61.8% |
[ 65.0% - 65.5% ] 65.21% | 203,859 | 63.4% |
[ 65.5% - 66.0% ] 65.89% | 445,746 | 62.0% |
[ 66.0% - 66.5% ] 66.24% | 177,048 | 69.6% |
[ 66.5% - 67.0% ] 66.71% | 296,860 | 72.6% |
[ 67.0% - 67.5% ] 67.29% | 307,612 | 63.9% |
[ 67.5% - 68.0% ] 67.62% | 344,341 | 60.6% |
[ 68.0% - 68.5% ] 68.21% | 466,375 | 72.4% |
[ 68.5% - 69.0% ] 68.71% | 210,860 | 65.7% |
[ 69.0% - 69.5% ] 69.26% | 492,465 | 62.0% |
[ 69.5% - 70.0% ] 69.85% | 264,207 | 64.9% |
[ 70.0% - 70.5% ] 70.20% | 224,662 | 63.1% |
[ 70.5% - 71.0% ] 70.71% | 504,387 | 62.6% |
[ 71.0% - 71.5% ] 71.26% | 545,024 | 62.4% |
[ 71.5% - 72.0% ] 71.75% | 581,760 | 62.5% |
[ 72.0% - 72.5% ] 72.17% | 193,763 | 63.8% |
[ 72.5% - 73.0% ] 72.78% | 386,075 | 59.8% |
[ 73.0% - 73.5% ] 73.22% | 405,058 | 63.1% |
[ 73.5% - 74.0% ] 73.79% | 191,126 | 63.6% |
[ 74.0% - 74.5% ] 74.21% | 397,820 | 58.1% |
[ 74.5% - 75.0% ] 74.76% | 190,341 | 68.5% |
[ 75.0% - 75.5% ] 75.34% | 392,157 | 69.7% |
[ 75.5% - 76.0% ] 75.81% | 240,043 | 59.5% |
[ 76.0% - 76.5% ] 76.29% | 237,471 | 54.2% |
[ 76.5% - 77.0% ] 76.71% | 856,084 | 73.0% |
[ 77.0% - 77.5% ] 77.31% | 383,631 | 58.6% |
[ 77.5% - 78.0% ] 77.85% | 198,774 | 71.0% |
[ 78.0% - 78.5% ] 78.30% | 149,710 | 67.3% |
[ 78.5% - 79.0% ] 78.83% | 272,110 | 63.5% |
[ 79.0% - 79.5% ] 79.22% | 295,581 | 58.8% |
[ 79.5% - 80.0% ] 79.62% | 121,906 | 56.5% |
[ 80.0% - 80.5% ] 80.24% | 673,592 | 58.1% |
[ 80.5% - 81.0% ] 80.81% | 104,903 | 65.9% |
[ 81.0% - 81.5% ] 81.18% | 325,245 | 58.6% |
[ 81.5% - 82.0% ] 81.74% | 357,068 | 70.4% |
[ 82.0% - 82.5% ] 82.18% | 191,477 | 57.7% |
[ 82.5% - 83.0% ] 82.66% | 105,734 | 65.0% |
[ 83.0% - 83.5% ] 83.15% | 265,636 | 72.8% |
[ 83.5% - 84.0% ] 83.84% | 210,058 | 62.4% |
[ 84.0% - 84.5% ] 84.26% | 285,886 | 64.3% |
[ 84.5% - 85.0% ] 84.67% | 77,718 | 62.4% |
[ 85.0% - 85.5% ] 85.20% | 80,600 | 64.3% |
[ 85.5% - 86.0% ] 85.74% | 24,380 | 58.3% |
[ 86.0% - 86.5% ] 86.16% | 108,707 | 73.2% |
[ 86.5% - 87.0% ] 86.85% | 169,567 | 54.1% |
[ 87.0% - 87.5% ] 87.27% | 246,907 | 63.8% |
[ 87.5% - 88.0% ] 87.70% | 229,558 | 56.9% |
[ 88.0% - 88.5% ] 88.19% | 132,908 | 55.1% |
[ 88.5% - 89.0% ] 88.74% | 80,081 | 52.3% |
[ 89.0% - 89.5% ] 89.27% | 143,849 | 53.4% |
[ 89.5% - 90.0% ] 89.81% | 318,725 | 63.4% |
[ 90.0% - 90.5% ] 90.22% | 360,166 | 62.3% |
[ 90.5% - 91.0% ] 90.73% | 198,502 | 58.4% |
[ 91.0% - 91.5% ] 91.34% | 514,098 | 56.1% |
[ 91.5% - 92.0% ] 91.78% | 292,897 | 61.0% |
[ 92.0% - 92.5% ] 92.33% | 54,451 | 43.4% |
[ 92.5% - 93.0% ] 92.78% | 178,418 | 52.5% |
[ 93.0% - 93.5% ] 93.28% | 95,227 | 60.2% |
[ 93.5% - 94.0% ] 93.77% | 99,772 | 55.0% |
[ 94.0% - 94.5% ] 94.27% | 178,878 | 57.4% |
[ 94.5% - 95.0% ] 94.80% | 121,556 | 57.4% |
[ 95.0% - 95.5% ] 95.26% | 75,853 | 51.4% |
[ 95.5% - 96.0% ] 95.84% | 24,646 | 62.1% |
[ 96.0% - 96.5% ] 96.29% | 28,097 | 52.2% |
[ 96.5% - 97.0% ] 96.77% | 28,254 | 49.9% |
[ 97.0% - 97.5% ] 97.21% | 22,835 | 50.4% |
[ 97.5% - 98.0% ] 97.76% | 43,324 | 51.5% |
[ 98.0% - 98.5% ] 98.25% | 19,383 | 63.1% |
[ 98.5% - 99.0% ] 98.66% | 27,768 | 53.7% |
[ 99.0% - 99.5% ] 99.18% | 16,801 | 50.5% |
[ 99.5% - 100.0% ] 99.96% | 66,231 | 50.0% |