Israeli 2 or more Vehicles in Household
COMPARE
Israeli
Select to Compare
2 or more Vehicles in Household
Israeli 2 or more Vehicles in Household
51.9%
2+ VEHICLES AVAILABLE
0.2/ 100
METRIC RATING
273rd/ 347
METRIC RANK
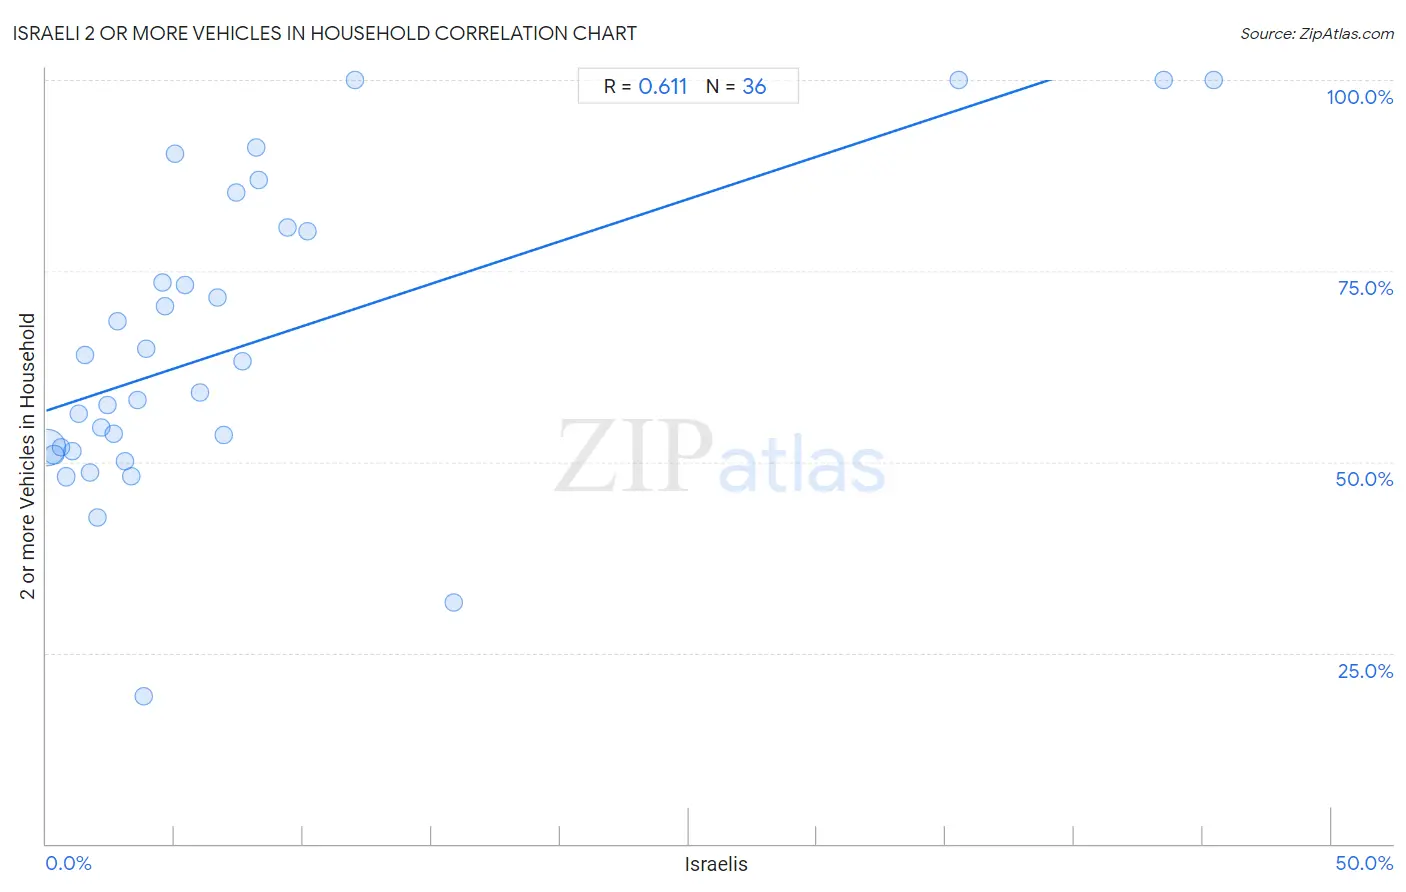
Israeli 2 or more Vehicles in Household Correlation Chart
The statistical analysis conducted on geographies consisting of 211,040,574 people shows a significant positive correlation between the proportion of Israelis and percentage of households with 2 or more vehicles available in the United States with a correlation coefficient (R) of 0.611 and weighted average of 51.9%. On average, for every 1% (one percent) increase in Israelis within a typical geography, there is an increase of 1.1% in percentage of households with 2 or more vehicles available.
It is essential to understand that the correlation between the percentage of Israelis and percentage of households with 2 or more vehicles available does not imply a direct cause-and-effect relationship. It remains uncertain whether the presence of Israelis influences an upward or downward trend in the level of percentage of households with 2 or more vehicles available within an area, or if Israelis simply ended up residing in those areas with higher or lower levels of percentage of households with 2 or more vehicles available due to other factors.
Demographics Similar to Israelis by 2 or more Vehicles in Household
In terms of 2 or more vehicles in household, the demographic groups most similar to Israelis are African (51.8%, a difference of 0.050%), Immigrants from Honduras (51.8%, a difference of 0.060%), Subsaharan African (51.9%, a difference of 0.090%), Immigrants from Croatia (51.8%, a difference of 0.090%), and South American (51.9%, a difference of 0.12%).
| Demographics | Rating | Rank | 2 or more Vehicles in Household |
| Immigrants from France | 0.2 /100 | #266 | Tragic 52.0% |
| Immigrants from Colombia | 0.2 /100 | #267 | Tragic 52.0% |
| Pima | 0.2 /100 | #268 | Tragic 52.0% |
| Hondurans | 0.2 /100 | #269 | Tragic 52.0% |
| Immigrants from Ireland | 0.2 /100 | #270 | Tragic 52.0% |
| South Americans | 0.2 /100 | #271 | Tragic 51.9% |
| Sub-Saharan Africans | 0.2 /100 | #272 | Tragic 51.9% |
| Israelis | 0.2 /100 | #273 | Tragic 51.9% |
| Africans | 0.2 /100 | #274 | Tragic 51.8% |
| Immigrants from Honduras | 0.2 /100 | #275 | Tragic 51.8% |
| Immigrants from Croatia | 0.2 /100 | #276 | Tragic 51.8% |
| Immigrants from Africa | 0.2 /100 | #277 | Tragic 51.8% |
| Yuman | 0.1 /100 | #278 | Tragic 51.7% |
| Liberians | 0.1 /100 | #279 | Tragic 51.7% |
| Immigrants from Eastern Europe | 0.1 /100 | #280 | Tragic 51.7% |
Israeli 2 or more Vehicles in Household Correlation Summary
| Measurement | Israeli Data | 2 or more Vehicles in Household Data |
| Minimum | 0.067% | 19.3% |
| Maximum | 45.4% | 100.0% |
| Range | 45.4% | 80.7% |
| Mean | 7.8% | 65.3% |
| Median | 4.2% | 61.1% |
| Interquartile 25% (IQ1) | 2.1% | 51.6% |
| Interquartile 75% (IQ3) | 7.9% | 80.4% |
| Interquartile Range (IQR) | 5.9% | 28.8% |
| Standard Deviation (Sample) | 11.0% | 19.9% |
| Standard Deviation (Population) | 10.8% | 19.6% |
Correlation Details
| Israeli Percentile | Sample Size | 2 or more Vehicles in Household |
[ 0.0% - 0.5% ] 0.067% | 182,675,356 | 51.8% |
[ 0.0% - 0.5% ] 0.31% | 18,384,322 | 50.9% |
[ 0.5% - 1.0% ] 0.57% | 4,284,024 | 52.0% |
[ 0.5% - 1.0% ] 0.78% | 2,004,396 | 48.1% |
[ 1.0% - 1.5% ] 1.02% | 1,397,733 | 51.4% |
[ 1.0% - 1.5% ] 1.26% | 624,589 | 56.3% |
[ 1.5% - 2.0% ] 1.50% | 254,179 | 63.9% |
[ 1.5% - 2.0% ] 1.70% | 376,622 | 48.6% |
[ 1.5% - 2.0% ] 1.98% | 240,808 | 42.6% |
[ 2.0% - 2.5% ] 2.12% | 237,176 | 54.5% |
[ 2.0% - 2.5% ] 2.40% | 130,559 | 57.5% |
[ 2.5% - 3.0% ] 2.63% | 66,201 | 53.7% |
[ 2.5% - 3.0% ] 2.76% | 57,201 | 68.4% |
[ 3.0% - 3.5% ] 3.06% | 68,936 | 50.1% |
[ 3.0% - 3.5% ] 3.29% | 70,940 | 48.2% |
[ 3.5% - 4.0% ] 3.53% | 71,502 | 58.2% |
[ 3.5% - 4.0% ] 3.79% | 32,884 | 19.3% |
[ 3.5% - 4.0% ] 3.90% | 5,617 | 64.8% |
[ 4.5% - 5.0% ] 4.52% | 598 | 73.4% |
[ 4.5% - 5.0% ] 4.61% | 18,210 | 70.4% |
[ 5.0% - 5.5% ] 5.00% | 520 | 90.4% |
[ 5.0% - 5.5% ] 5.40% | 5,393 | 73.1% |
[ 5.5% - 6.0% ] 5.98% | 8,851 | 59.1% |
[ 6.5% - 7.0% ] 6.66% | 4,550 | 71.5% |
[ 6.5% - 7.0% ] 6.91% | 7,307 | 53.6% |
[ 7.0% - 7.5% ] 7.39% | 717 | 85.3% |
[ 7.5% - 8.0% ] 7.65% | 810 | 63.1% |
[ 8.0% - 8.5% ] 8.15% | 319 | 91.1% |
[ 8.0% - 8.5% ] 8.26% | 1,066 | 86.8% |
[ 9.0% - 9.5% ] 9.41% | 6,123 | 80.7% |
[ 10.0% - 10.5% ] 10.17% | 1,534 | 80.1% |
[ 12.0% - 12.5% ] 12.03% | 349 | 100.0% |
[ 15.5% - 16.0% ] 15.84% | 486 | 31.6% |
[ 35.0% - 35.5% ] 35.48% | 93 | 100.0% |
[ 43.5% - 44.0% ] 43.51% | 308 | 100.0% |
[ 45.0% - 45.5% ] 45.42% | 295 | 100.0% |