Zip Codes with the Highest Percentage of Households with Income Above $200,000 in Rancho Santa Fe, CA
RELATED REPORTS & OPTIONS
Household Income | $200k+
Rancho Santa Fe
Compare Zip Codes
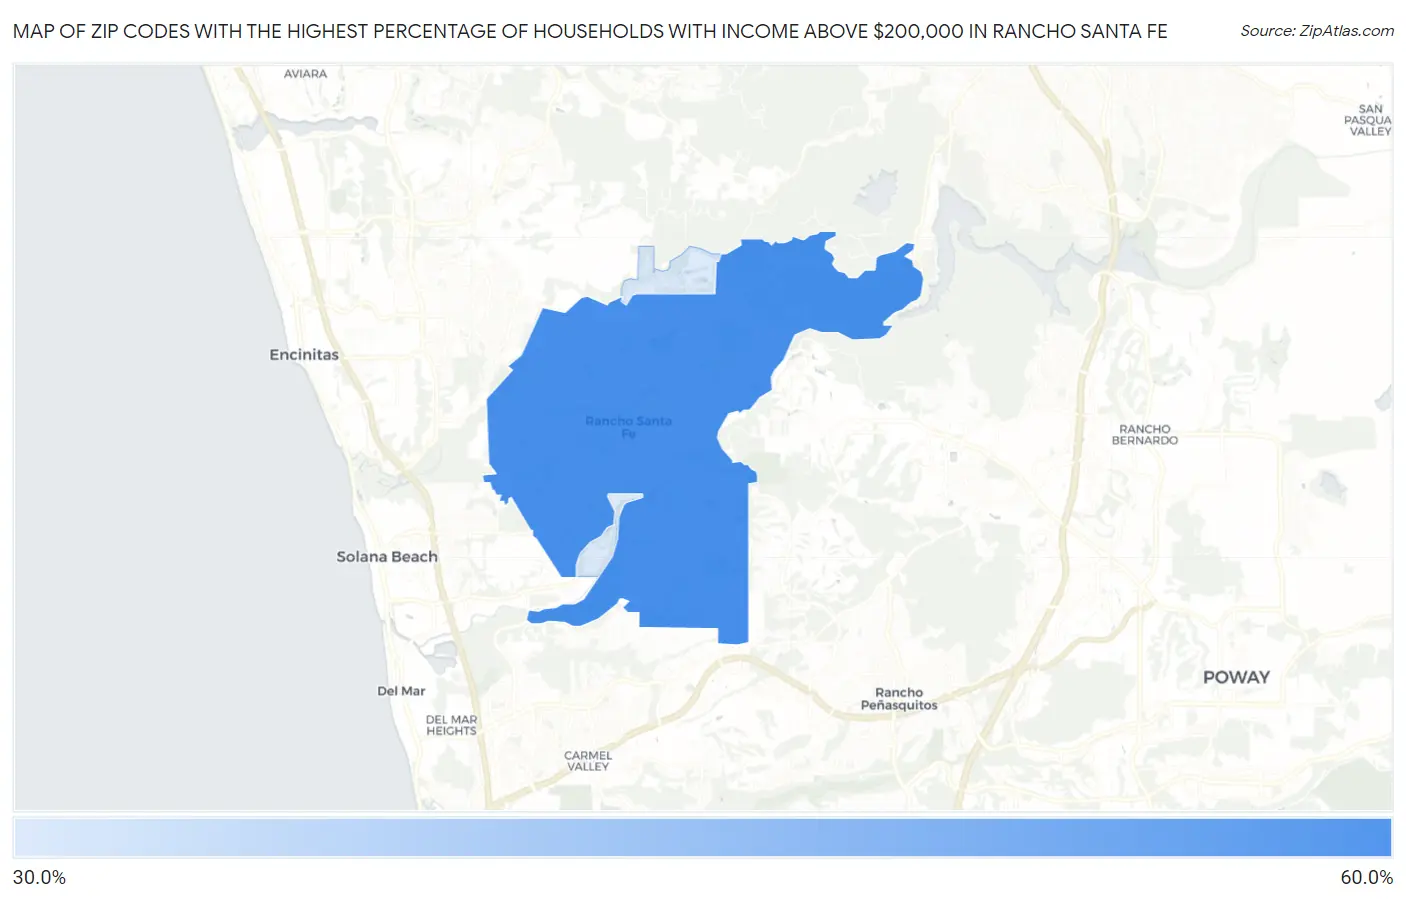
Map of Zip Codes with the Highest Percentage of Households with Income Above $200,000 in Rancho Santa Fe
32.3%
54.3%
Zip Codes with the Highest Percentage of Households with Income Above $200,000 in Rancho Santa Fe, CA
| Zip Code | Households with Income > $200k | vs State | vs National | |
| 1. | 92067 | 54.3% | 17.9%(+36.4)#26 | 11.4%(+42.9)#189 |
| 2. | 92091 | 32.3% | 17.9%(+14.4)#211 | 11.4%(+20.9)#1,225 |
1
Common Questions
What are the Top Zip Codes with the Highest Percentage of Households with Income Above $200,000 in Rancho Santa Fe, CA?
Top Zip Codes with the Highest Percentage of Households with Income Above $200,000 in Rancho Santa Fe, CA are:
What zip code has the Highest Percentage of Households with Income Above $200,000 in Rancho Santa Fe, CA?
92067 has the Highest Percentage of Households with Income Above $200,000 in Rancho Santa Fe, CA with 54.3%.
What is the Percentage of Households with Income Above $200,000 in Rancho Santa Fe, CA?
Percentage of Households with Income Above $200,000 in Rancho Santa Fe is 54.6%.
What is the Percentage of Households with Income Above $200,000 in California?
Percentage of Households with Income Above $200,000 in California is 17.9%.
What is the Percentage of Households with Income Above $200,000 in the United States?
Percentage of Households with Income Above $200,000 in the United States is 11.4%.