Sri Lankan vs Immigrants from Afghanistan No Vehicles in Household
COMPARE
Sri Lankan
Immigrants from Afghanistan
No Vehicles in Household
No Vehicles in Household Comparison
Sri Lankans
Immigrants from Afghanistan
7.6%
NO VEHICLES IN HOUSEHOLD
100.0/ 100
METRIC RATING
26th/ 347
METRIC RANK
8.1%
NO VEHICLES IN HOUSEHOLD
99.9/ 100
METRIC RATING
56th/ 347
METRIC RANK
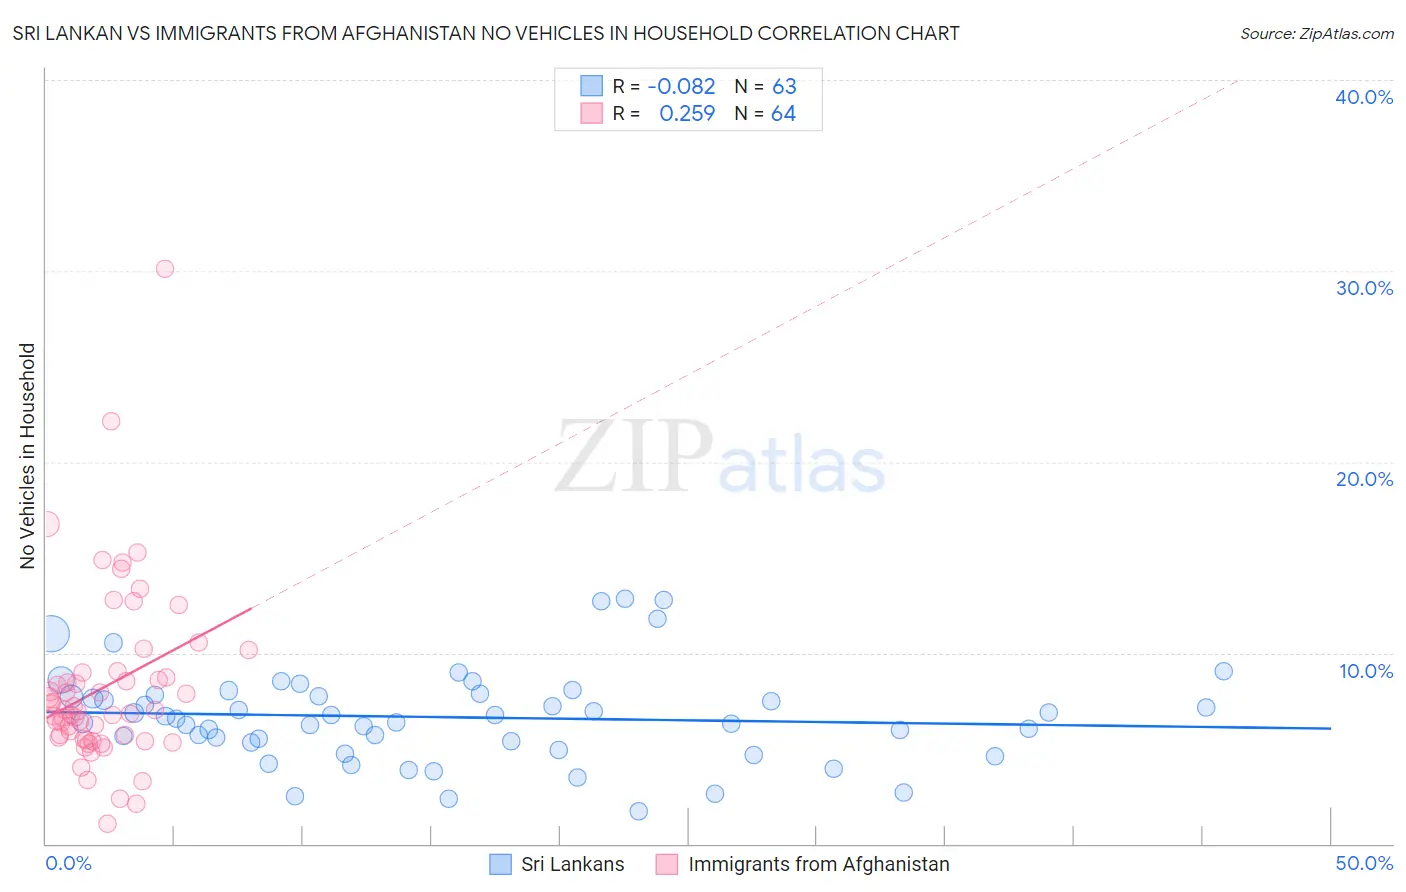
Sri Lankan vs Immigrants from Afghanistan No Vehicles in Household Correlation Chart
The statistical analysis conducted on geographies consisting of 439,098,815 people shows a slight negative correlation between the proportion of Sri Lankans and percentage of households with no vehicle available in the United States with a correlation coefficient (R) of -0.082 and weighted average of 7.6%. Similarly, the statistical analysis conducted on geographies consisting of 147,593,124 people shows a weak positive correlation between the proportion of Immigrants from Afghanistan and percentage of households with no vehicle available in the United States with a correlation coefficient (R) of 0.259 and weighted average of 8.1%, a difference of 6.8%.
No Vehicles in Household Correlation Summary
| Measurement | Sri Lankan | Immigrants from Afghanistan |
| Minimum | 1.7% | 1.1% |
| Maximum | 12.8% | 30.1% |
| Range | 11.2% | 29.0% |
| Mean | 6.6% | 8.2% |
| Median | 6.5% | 7.0% |
| Interquartile 25% (IQ1) | 5.3% | 5.6% |
| Interquartile 75% (IQ3) | 7.8% | 8.8% |
| Interquartile Range (IQR) | 2.5% | 3.3% |
| Standard Deviation (Sample) | 2.5% | 4.7% |
| Standard Deviation (Population) | 2.4% | 4.6% |
Similar Demographics by No Vehicles in Household
Demographics Similar to Sri Lankans by No Vehicles in Household
In terms of no vehicles in household, the demographic groups most similar to Sri Lankans are British (7.6%, a difference of 0.050%), Samoan (7.6%, a difference of 0.60%), American (7.7%, a difference of 0.89%), Finnish (7.7%, a difference of 1.2%), and Native Hawaiian (7.7%, a difference of 1.3%).
| Demographics | Rating | Rank | No Vehicles in Household |
| Arapaho | 100.0 /100 | #19 | Exceptional 7.4% |
| Ottawa | 100.0 /100 | #20 | Exceptional 7.4% |
| Nepalese | 100.0 /100 | #21 | Exceptional 7.4% |
| Irish | 100.0 /100 | #22 | Exceptional 7.4% |
| French | 100.0 /100 | #23 | Exceptional 7.4% |
| Immigrants | Iraq | 100.0 /100 | #24 | Exceptional 7.5% |
| Yaqui | 100.0 /100 | #25 | Exceptional 7.5% |
| Sri Lankans | 100.0 /100 | #26 | Exceptional 7.6% |
| British | 100.0 /100 | #27 | Exceptional 7.6% |
| Samoans | 100.0 /100 | #28 | Exceptional 7.6% |
| Americans | 100.0 /100 | #29 | Exceptional 7.7% |
| Finns | 100.0 /100 | #30 | Exceptional 7.7% |
| Native Hawaiians | 100.0 /100 | #31 | Exceptional 7.7% |
| Malaysians | 100.0 /100 | #32 | Exceptional 7.7% |
| Immigrants | Taiwan | 100.0 /100 | #33 | Exceptional 7.7% |
Demographics Similar to Immigrants from Afghanistan by No Vehicles in Household
In terms of no vehicles in household, the demographic groups most similar to Immigrants from Afghanistan are Venezuelan (8.1%, a difference of 0.28%), Celtic (8.1%, a difference of 0.39%), Immigrants from Mexico (8.1%, a difference of 0.39%), Immigrants from Venezuela (8.1%, a difference of 0.48%), and Immigrants from India (8.2%, a difference of 0.74%).
| Demographics | Rating | Rank | No Vehicles in Household |
| Guamanians/Chamorros | 99.9 /100 | #49 | Exceptional 8.0% |
| Belgians | 99.9 /100 | #50 | Exceptional 8.0% |
| Koreans | 99.9 /100 | #51 | Exceptional 8.0% |
| Hawaiians | 99.9 /100 | #52 | Exceptional 8.0% |
| Slovenes | 99.9 /100 | #53 | Exceptional 8.0% |
| Immigrants | Venezuela | 99.9 /100 | #54 | Exceptional 8.1% |
| Celtics | 99.9 /100 | #55 | Exceptional 8.1% |
| Immigrants | Afghanistan | 99.9 /100 | #56 | Exceptional 8.1% |
| Venezuelans | 99.8 /100 | #57 | Exceptional 8.1% |
| Immigrants | Mexico | 99.8 /100 | #58 | Exceptional 8.1% |
| Immigrants | India | 99.8 /100 | #59 | Exceptional 8.2% |
| Immigrants | Laos | 99.8 /100 | #60 | Exceptional 8.2% |
| Thais | 99.8 /100 | #61 | Exceptional 8.2% |
| Chinese | 99.8 /100 | #62 | Exceptional 8.2% |
| Slovaks | 99.8 /100 | #63 | Exceptional 8.3% |