Immigrants from Zimbabwe vs Immigrants from Barbados No Vehicles in Household
COMPARE
Immigrants from Zimbabwe
Immigrants from Barbados
No Vehicles in Household
No Vehicles in Household Comparison
Immigrants from Zimbabwe
Immigrants from Barbados
9.9%
NO VEHICLES IN HOUSEHOLD
82.6/ 100
METRIC RATING
142nd/ 347
METRIC RANK
29.5%
NO VEHICLES IN HOUSEHOLD
0.0/ 100
METRIC RATING
340th/ 347
METRIC RANK
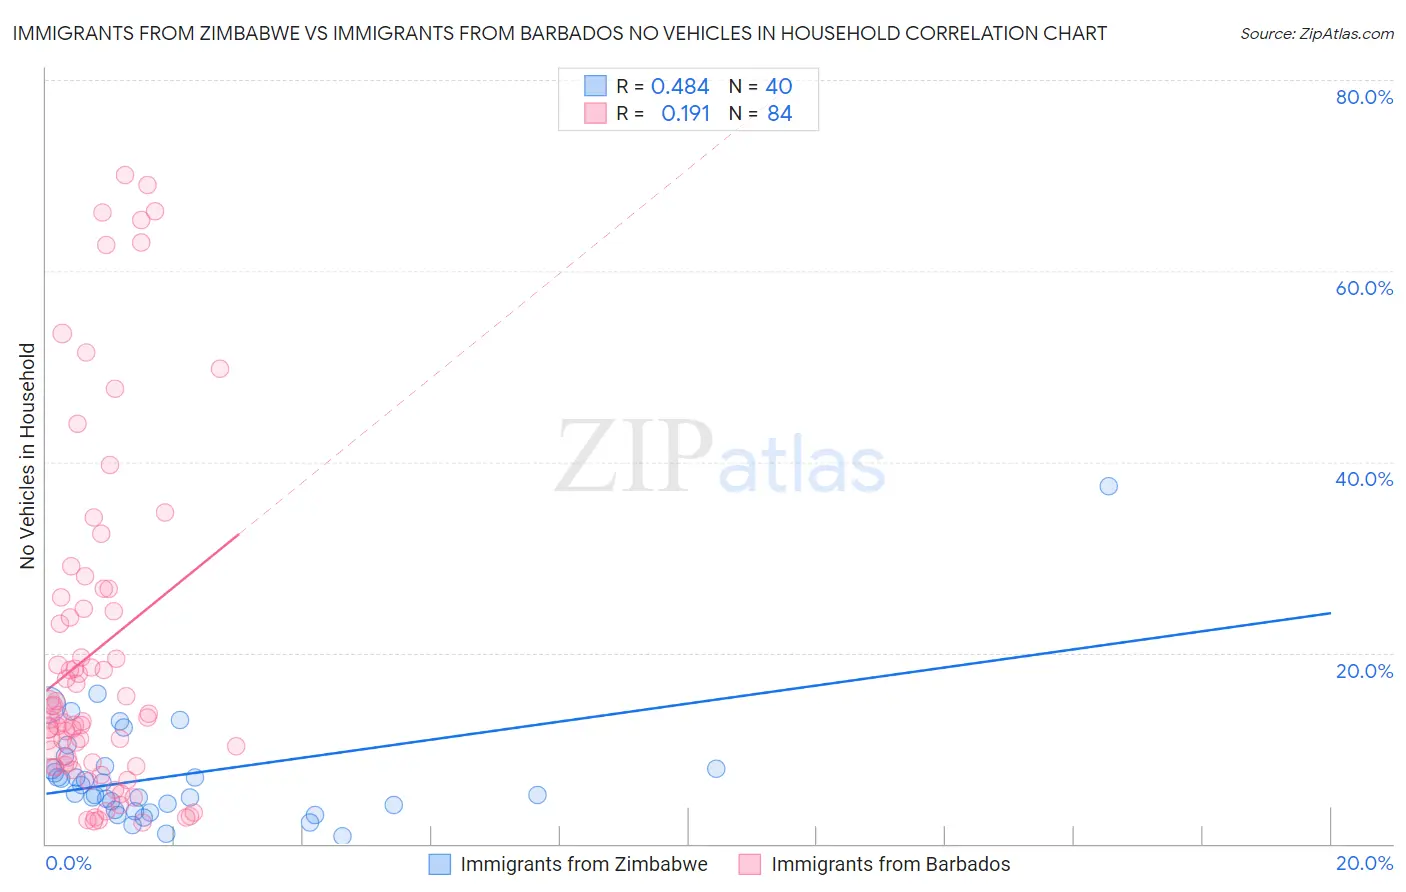
Immigrants from Zimbabwe vs Immigrants from Barbados No Vehicles in Household Correlation Chart
The statistical analysis conducted on geographies consisting of 117,693,810 people shows a moderate positive correlation between the proportion of Immigrants from Zimbabwe and percentage of households with no vehicle available in the United States with a correlation coefficient (R) of 0.484 and weighted average of 9.9%. Similarly, the statistical analysis conducted on geographies consisting of 112,757,088 people shows a poor positive correlation between the proportion of Immigrants from Barbados and percentage of households with no vehicle available in the United States with a correlation coefficient (R) of 0.191 and weighted average of 29.5%, a difference of 199.1%.
No Vehicles in Household Correlation Summary
| Measurement | Immigrants from Zimbabwe | Immigrants from Barbados |
| Minimum | 0.74% | 2.2% |
| Maximum | 37.5% | 70.0% |
| Range | 36.8% | 67.8% |
| Mean | 7.2% | 20.3% |
| Median | 5.8% | 13.4% |
| Interquartile 25% (IQ1) | 3.8% | 8.3% |
| Interquartile 75% (IQ3) | 8.0% | 25.2% |
| Interquartile Range (IQR) | 4.2% | 16.9% |
| Standard Deviation (Sample) | 6.2% | 18.1% |
| Standard Deviation (Population) | 6.1% | 18.0% |
Similar Demographics by No Vehicles in Household
Demographics Similar to Immigrants from Zimbabwe by No Vehicles in Household
In terms of no vehicles in household, the demographic groups most similar to Immigrants from Zimbabwe are Sudanese (9.8%, a difference of 0.13%), Immigrants from Lithuania (9.8%, a difference of 0.35%), Chilean (9.9%, a difference of 0.35%), Immigrants from Bahamas (9.9%, a difference of 0.35%), and Marshallese (9.8%, a difference of 0.36%).
| Demographics | Rating | Rank | No Vehicles in Household |
| Latvians | 85.1 /100 | #135 | Excellent 9.8% |
| Immigrants | South Africa | 85.0 /100 | #136 | Excellent 9.8% |
| Immigrants | Moldova | 84.6 /100 | #137 | Excellent 9.8% |
| Estonians | 84.2 /100 | #138 | Excellent 9.8% |
| Marshallese | 84.0 /100 | #139 | Excellent 9.8% |
| Immigrants | Lithuania | 84.0 /100 | #140 | Excellent 9.8% |
| Sudanese | 83.1 /100 | #141 | Excellent 9.8% |
| Immigrants | Zimbabwe | 82.6 /100 | #142 | Excellent 9.9% |
| Chileans | 81.2 /100 | #143 | Excellent 9.9% |
| Immigrants | Bahamas | 81.2 /100 | #144 | Excellent 9.9% |
| Bahamians | 81.0 /100 | #145 | Excellent 9.9% |
| Hungarians | 80.0 /100 | #146 | Excellent 9.9% |
| Immigrants | Nicaragua | 79.8 /100 | #147 | Good 9.9% |
| Immigrants | Bosnia and Herzegovina | 79.1 /100 | #148 | Good 9.9% |
| Immigrants | Uganda | 76.1 /100 | #149 | Good 10.0% |
Demographics Similar to Immigrants from Barbados by No Vehicles in Household
In terms of no vehicles in household, the demographic groups most similar to Immigrants from Barbados are Immigrants from Guyana (29.5%, a difference of 0.050%), Dominican (29.4%, a difference of 0.23%), Guyanese (29.3%, a difference of 0.59%), British West Indian (29.7%, a difference of 0.90%), and Inupiat (29.9%, a difference of 1.3%).
| Demographics | Rating | Rank | No Vehicles in Household |
| Immigrants | Trinidad and Tobago | 0.0 /100 | #333 | Tragic 24.6% |
| Immigrants | Bangladesh | 0.0 /100 | #334 | Tragic 25.8% |
| Barbadians | 0.0 /100 | #335 | Tragic 26.1% |
| Vietnamese | 0.0 /100 | #336 | Tragic 26.2% |
| Immigrants | Uzbekistan | 0.0 /100 | #337 | Tragic 26.7% |
| Guyanese | 0.0 /100 | #338 | Tragic 29.3% |
| Dominicans | 0.0 /100 | #339 | Tragic 29.4% |
| Immigrants | Barbados | 0.0 /100 | #340 | Tragic 29.5% |
| Immigrants | Guyana | 0.0 /100 | #341 | Tragic 29.5% |
| British West Indians | 0.0 /100 | #342 | Tragic 29.7% |
| Inupiat | 0.0 /100 | #343 | Tragic 29.9% |
| Immigrants | Dominican Republic | 0.0 /100 | #344 | Tragic 31.4% |
| Immigrants | St. Vincent and the Grenadines | 0.0 /100 | #345 | Tragic 35.4% |
| Immigrants | Grenada | 0.0 /100 | #346 | Tragic 37.5% |
| Yup'ik | 0.0 /100 | #347 | Tragic 45.9% |