Immigrants from Southern Europe vs Immigrants from Belgium No Vehicles in Household
COMPARE
Immigrants from Southern Europe
Immigrants from Belgium
No Vehicles in Household
No Vehicles in Household Comparison
Immigrants from Southern Europe
Immigrants from Belgium
13.0%
NO VEHICLES IN HOUSEHOLD
0.1/ 100
METRIC RATING
276th/ 347
METRIC RANK
11.8%
NO VEHICLES IN HOUSEHOLD
1.9/ 100
METRIC RATING
248th/ 347
METRIC RANK
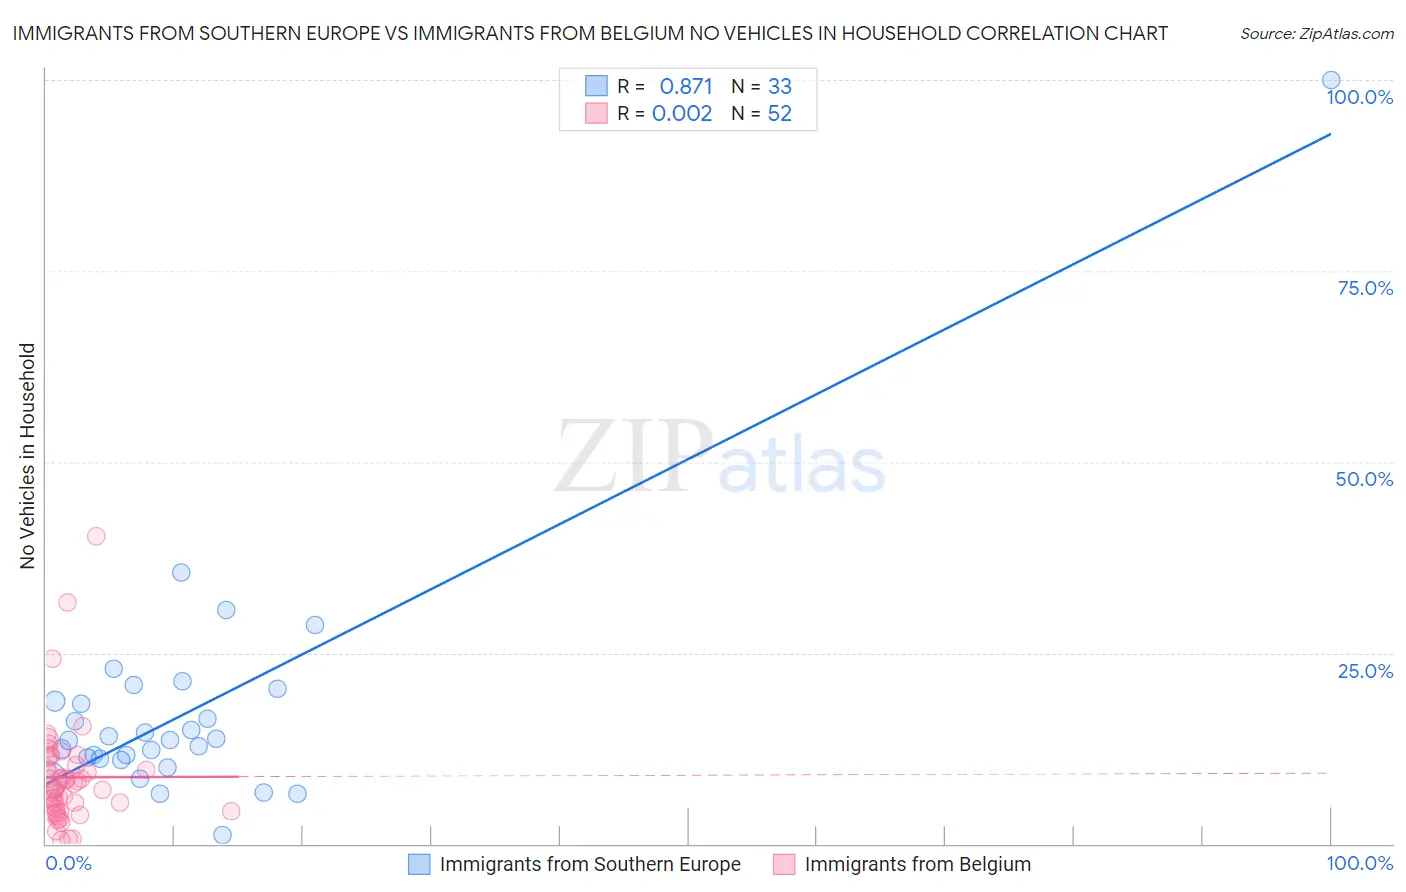
Immigrants from Southern Europe vs Immigrants from Belgium No Vehicles in Household Correlation Chart
The statistical analysis conducted on geographies consisting of 401,727,982 people shows a very strong positive correlation between the proportion of Immigrants from Southern Europe and percentage of households with no vehicle available in the United States with a correlation coefficient (R) of 0.871 and weighted average of 13.0%. Similarly, the statistical analysis conducted on geographies consisting of 146,599,781 people shows no correlation between the proportion of Immigrants from Belgium and percentage of households with no vehicle available in the United States with a correlation coefficient (R) of 0.002 and weighted average of 11.8%, a difference of 10.4%.
No Vehicles in Household Correlation Summary
| Measurement | Immigrants from Southern Europe | Immigrants from Belgium |
| Minimum | 1.1% | 0.44% |
| Maximum | 100.0% | 40.2% |
| Range | 98.9% | 39.7% |
| Mean | 17.5% | 8.7% |
| Median | 13.6% | 7.5% |
| Interquartile 25% (IQ1) | 11.1% | 4.4% |
| Interquartile 75% (IQ3) | 19.5% | 10.8% |
| Interquartile Range (IQR) | 8.4% | 6.3% |
| Standard Deviation (Sample) | 16.5% | 7.0% |
| Standard Deviation (Population) | 16.2% | 7.0% |
Similar Demographics by No Vehicles in Household
Demographics Similar to Immigrants from Southern Europe by No Vehicles in Household
In terms of no vehicles in household, the demographic groups most similar to Immigrants from Southern Europe are Aleut (13.0%, a difference of 0.080%), Immigrants from Croatia (13.0%, a difference of 0.12%), Immigrants from Albania (13.0%, a difference of 0.36%), Immigrants from Singapore (12.9%, a difference of 0.54%), and Immigrants from France (12.9%, a difference of 0.58%).
| Demographics | Rating | Rank | No Vehicles in Household |
| Panamanians | 0.2 /100 | #269 | Tragic 12.5% |
| Immigrants | Northern Africa | 0.2 /100 | #270 | Tragic 12.6% |
| Immigrants | Morocco | 0.2 /100 | #271 | Tragic 12.6% |
| Bermudans | 0.1 /100 | #272 | Tragic 12.8% |
| Immigrants | France | 0.1 /100 | #273 | Tragic 12.9% |
| Immigrants | Singapore | 0.1 /100 | #274 | Tragic 12.9% |
| Immigrants | Albania | 0.1 /100 | #275 | Tragic 13.0% |
| Immigrants | Southern Europe | 0.1 /100 | #276 | Tragic 13.0% |
| Aleuts | 0.1 /100 | #277 | Tragic 13.0% |
| Immigrants | Croatia | 0.1 /100 | #278 | Tragic 13.0% |
| Mongolians | 0.0 /100 | #279 | Tragic 13.1% |
| Alsatians | 0.0 /100 | #280 | Tragic 13.2% |
| Central American Indians | 0.0 /100 | #281 | Tragic 13.3% |
| Immigrants | Eastern Asia | 0.0 /100 | #282 | Tragic 13.5% |
| Immigrants | Kazakhstan | 0.0 /100 | #283 | Tragic 13.6% |
Demographics Similar to Immigrants from Belgium by No Vehicles in Household
In terms of no vehicles in household, the demographic groups most similar to Immigrants from Belgium are Immigrants from Czechoslovakia (11.8%, a difference of 0.010%), Immigrants from Nigeria (11.8%, a difference of 0.030%), Menominee (11.8%, a difference of 0.060%), Immigrants from Honduras (11.8%, a difference of 0.23%), and Paiute (11.8%, a difference of 0.26%).
| Demographics | Rating | Rank | No Vehicles in Household |
| Eastern Europeans | 2.7 /100 | #241 | Tragic 11.7% |
| Turks | 2.6 /100 | #242 | Tragic 11.7% |
| Cheyenne | 2.4 /100 | #243 | Tragic 11.7% |
| Immigrants | Portugal | 2.2 /100 | #244 | Tragic 11.7% |
| Immigrants | Honduras | 2.1 /100 | #245 | Tragic 11.8% |
| Menominee | 2.0 /100 | #246 | Tragic 11.8% |
| Immigrants | Czechoslovakia | 2.0 /100 | #247 | Tragic 11.8% |
| Immigrants | Belgium | 1.9 /100 | #248 | Tragic 11.8% |
| Immigrants | Nigeria | 1.9 /100 | #249 | Tragic 11.8% |
| Paiute | 1.8 /100 | #250 | Tragic 11.8% |
| Blacks/African Americans | 1.6 /100 | #251 | Tragic 11.9% |
| Immigrants | Serbia | 1.5 /100 | #252 | Tragic 11.9% |
| Egyptians | 1.4 /100 | #253 | Tragic 11.9% |
| Immigrants | Uruguay | 1.3 /100 | #254 | Tragic 11.9% |
| Hondurans | 1.2 /100 | #255 | Tragic 12.0% |