Immigrants from Philippines vs Brazilian No Vehicles in Household
COMPARE
Immigrants from Philippines
Brazilian
No Vehicles in Household
No Vehicles in Household Comparison
Immigrants from Philippines
Brazilians
8.5%
NO VEHICLES IN HOUSEHOLD
99.5/ 100
METRIC RATING
76th/ 347
METRIC RANK
10.4%
NO VEHICLES IN HOUSEHOLD
51.7/ 100
METRIC RATING
172nd/ 347
METRIC RANK
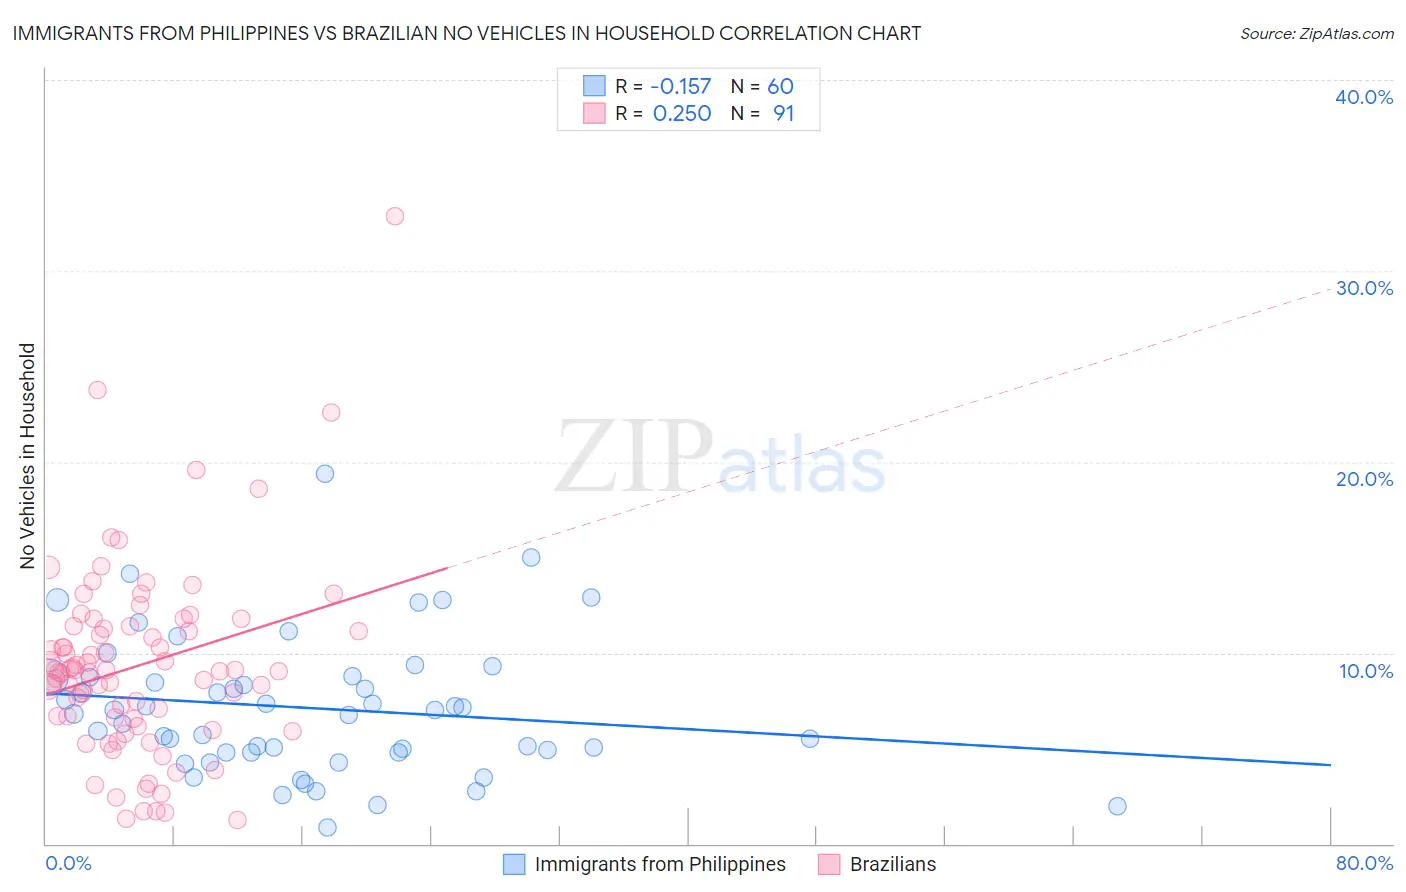
Immigrants from Philippines vs Brazilian No Vehicles in Household Correlation Chart
The statistical analysis conducted on geographies consisting of 469,724,480 people shows a poor negative correlation between the proportion of Immigrants from Philippines and percentage of households with no vehicle available in the United States with a correlation coefficient (R) of -0.157 and weighted average of 8.5%. Similarly, the statistical analysis conducted on geographies consisting of 322,964,874 people shows a weak positive correlation between the proportion of Brazilians and percentage of households with no vehicle available in the United States with a correlation coefficient (R) of 0.250 and weighted average of 10.4%, a difference of 21.4%.
No Vehicles in Household Correlation Summary
| Measurement | Immigrants from Philippines | Brazilian |
| Minimum | 0.84% | 1.2% |
| Maximum | 19.4% | 32.9% |
| Range | 18.6% | 31.6% |
| Mean | 7.1% | 9.3% |
| Median | 6.9% | 9.0% |
| Interquartile 25% (IQ1) | 4.8% | 6.6% |
| Interquartile 75% (IQ3) | 8.7% | 11.4% |
| Interquartile Range (IQR) | 4.0% | 4.8% |
| Standard Deviation (Sample) | 3.6% | 5.0% |
| Standard Deviation (Population) | 3.6% | 5.0% |
Similar Demographics by No Vehicles in Household
Demographics Similar to Immigrants from Philippines by No Vehicles in Household
In terms of no vehicles in household, the demographic groups most similar to Immigrants from Philippines are Iranian (8.6%, a difference of 0.090%), Immigrants from South Central Asia (8.6%, a difference of 0.21%), Jordanian (8.5%, a difference of 0.24%), Portuguese (8.6%, a difference of 0.26%), and Bolivian (8.6%, a difference of 0.41%).
| Demographics | Rating | Rank | No Vehicles in Household |
| Spaniards | 99.7 /100 | #69 | Exceptional 8.4% |
| Cajuns | 99.6 /100 | #70 | Exceptional 8.4% |
| Immigrants | Lebanon | 99.6 /100 | #71 | Exceptional 8.4% |
| Lithuanians | 99.6 /100 | #72 | Exceptional 8.4% |
| Poles | 99.6 /100 | #73 | Exceptional 8.4% |
| Cubans | 99.5 /100 | #74 | Exceptional 8.5% |
| Jordanians | 99.5 /100 | #75 | Exceptional 8.5% |
| Immigrants | Philippines | 99.5 /100 | #76 | Exceptional 8.5% |
| Iranians | 99.5 /100 | #77 | Exceptional 8.6% |
| Immigrants | South Central Asia | 99.5 /100 | #78 | Exceptional 8.6% |
| Portuguese | 99.5 /100 | #79 | Exceptional 8.6% |
| Bolivians | 99.4 /100 | #80 | Exceptional 8.6% |
| Tsimshian | 99.4 /100 | #81 | Exceptional 8.6% |
| Immigrants | South Eastern Asia | 99.4 /100 | #82 | Exceptional 8.6% |
| Italians | 99.4 /100 | #83 | Exceptional 8.6% |
Demographics Similar to Brazilians by No Vehicles in Household
In terms of no vehicles in household, the demographic groups most similar to Brazilians are Hmong (10.4%, a difference of 0.14%), Immigrants from Latin America (10.4%, a difference of 0.21%), Filipino (10.4%, a difference of 0.22%), Immigrants from Sudan (10.4%, a difference of 0.23%), and Immigrants from Burma/Myanmar (10.4%, a difference of 0.34%).
| Demographics | Rating | Rank | No Vehicles in Household |
| Comanche | 60.8 /100 | #165 | Good 10.2% |
| Immigrants | Costa Rica | 60.5 /100 | #166 | Good 10.3% |
| Immigrants | Saudi Arabia | 58.8 /100 | #167 | Average 10.3% |
| Indonesians | 56.7 /100 | #168 | Average 10.3% |
| Lumbee | 54.7 /100 | #169 | Average 10.3% |
| Immigrants | Latin America | 53.2 /100 | #170 | Average 10.4% |
| Hmong | 52.7 /100 | #171 | Average 10.4% |
| Brazilians | 51.7 /100 | #172 | Average 10.4% |
| Filipinos | 50.1 /100 | #173 | Average 10.4% |
| Immigrants | Sudan | 50.0 /100 | #174 | Average 10.4% |
| Immigrants | Burma/Myanmar | 49.1 /100 | #175 | Average 10.4% |
| French American Indians | 49.1 /100 | #176 | Average 10.4% |
| Immigrants | El Salvador | 49.1 /100 | #177 | Average 10.4% |
| Immigrants | Ethiopia | 48.0 /100 | #178 | Average 10.4% |
| Ethiopians | 45.8 /100 | #179 | Average 10.5% |