Immigrants from Nicaragua vs Immigrants from Guatemala No Vehicles in Household
COMPARE
Immigrants from Nicaragua
Immigrants from Guatemala
No Vehicles in Household
No Vehicles in Household Comparison
Immigrants from Nicaragua
Immigrants from Guatemala
9.9%
NO VEHICLES IN HOUSEHOLD
79.8/ 100
METRIC RATING
147th/ 347
METRIC RANK
11.2%
NO VEHICLES IN HOUSEHOLD
10.0/ 100
METRIC RATING
218th/ 347
METRIC RANK
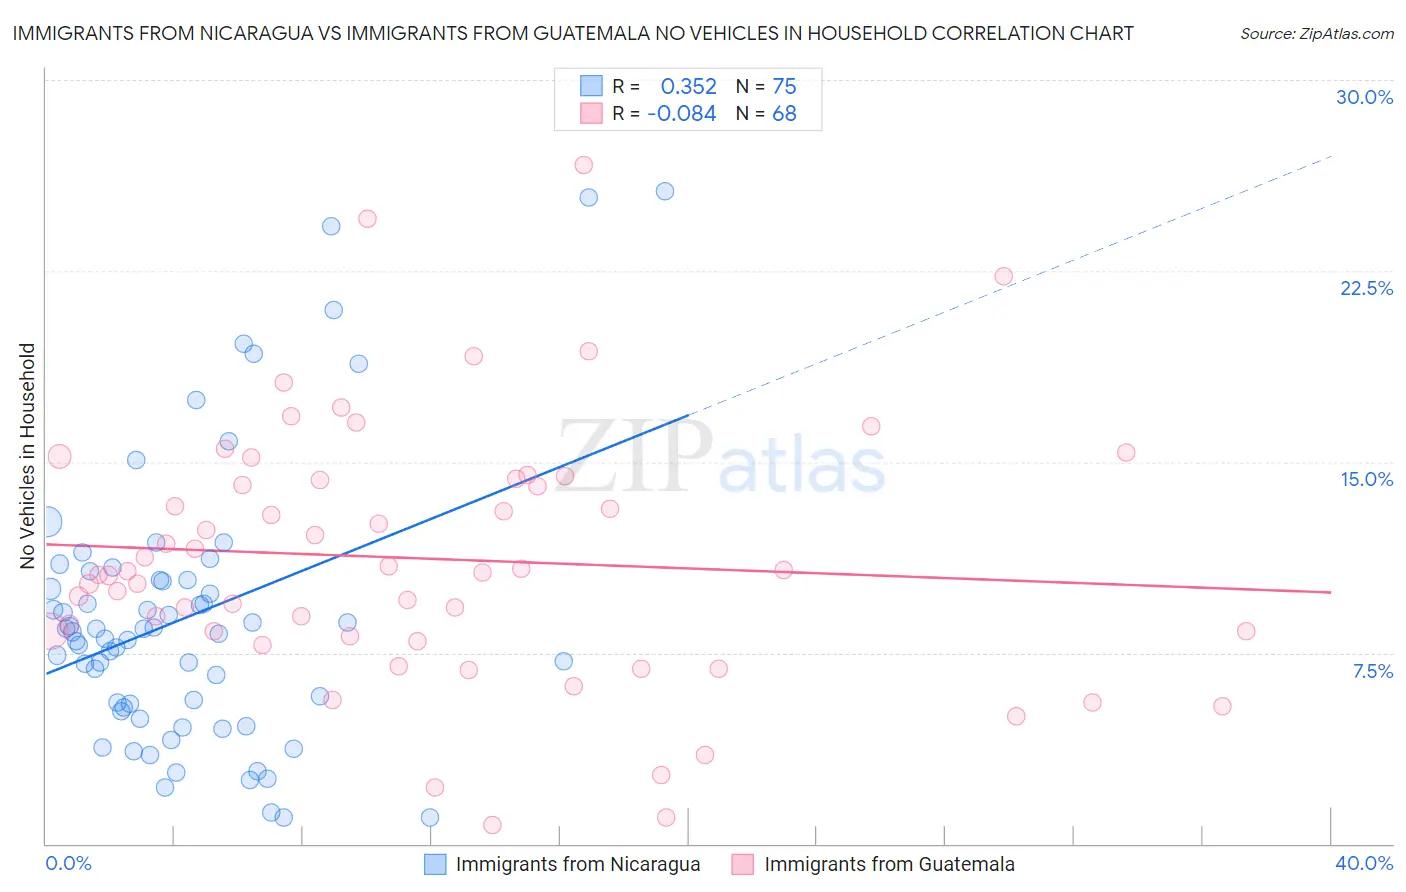
Immigrants from Nicaragua vs Immigrants from Guatemala No Vehicles in Household Correlation Chart
The statistical analysis conducted on geographies consisting of 236,149,436 people shows a mild positive correlation between the proportion of Immigrants from Nicaragua and percentage of households with no vehicle available in the United States with a correlation coefficient (R) of 0.352 and weighted average of 9.9%. Similarly, the statistical analysis conducted on geographies consisting of 376,643,696 people shows a slight negative correlation between the proportion of Immigrants from Guatemala and percentage of households with no vehicle available in the United States with a correlation coefficient (R) of -0.084 and weighted average of 11.2%, a difference of 12.7%.
No Vehicles in Household Correlation Summary
| Measurement | Immigrants from Nicaragua | Immigrants from Guatemala |
| Minimum | 1.0% | 0.74% |
| Maximum | 25.6% | 26.6% |
| Range | 24.6% | 25.9% |
| Mean | 8.9% | 11.2% |
| Median | 8.3% | 10.7% |
| Interquartile 25% (IQ1) | 5.4% | 8.2% |
| Interquartile 75% (IQ3) | 10.4% | 14.3% |
| Interquartile Range (IQR) | 5.0% | 6.1% |
| Standard Deviation (Sample) | 5.4% | 5.1% |
| Standard Deviation (Population) | 5.4% | 5.1% |
Similar Demographics by No Vehicles in Household
Demographics Similar to Immigrants from Nicaragua by No Vehicles in Household
In terms of no vehicles in household, the demographic groups most similar to Immigrants from Nicaragua are Hungarian (9.9%, a difference of 0.060%), Immigrants from Bosnia and Herzegovina (9.9%, a difference of 0.15%), Bahamian (9.9%, a difference of 0.28%), Chilean (9.9%, a difference of 0.31%), and Immigrants from Bahamas (9.9%, a difference of 0.31%).
| Demographics | Rating | Rank | No Vehicles in Household |
| Immigrants | Lithuania | 84.0 /100 | #140 | Excellent 9.8% |
| Sudanese | 83.1 /100 | #141 | Excellent 9.8% |
| Immigrants | Zimbabwe | 82.6 /100 | #142 | Excellent 9.9% |
| Chileans | 81.2 /100 | #143 | Excellent 9.9% |
| Immigrants | Bahamas | 81.2 /100 | #144 | Excellent 9.9% |
| Bahamians | 81.0 /100 | #145 | Excellent 9.9% |
| Hungarians | 80.0 /100 | #146 | Excellent 9.9% |
| Immigrants | Nicaragua | 79.8 /100 | #147 | Good 9.9% |
| Immigrants | Bosnia and Herzegovina | 79.1 /100 | #148 | Good 9.9% |
| Immigrants | Uganda | 76.1 /100 | #149 | Good 10.0% |
| Colombians | 73.9 /100 | #150 | Good 10.0% |
| Immigrants | Eastern Africa | 73.8 /100 | #151 | Good 10.0% |
| Immigrants | Congo | 73.0 /100 | #152 | Good 10.1% |
| Tlingit-Haida | 72.5 /100 | #153 | Good 10.1% |
| Sioux | 72.4 /100 | #154 | Good 10.1% |
Demographics Similar to Immigrants from Guatemala by No Vehicles in Household
In terms of no vehicles in household, the demographic groups most similar to Immigrants from Guatemala are Dutch West Indian (11.2%, a difference of 0.10%), Argentinean (11.2%, a difference of 0.12%), Immigrants from Zaire (11.2%, a difference of 0.14%), Immigrants from Argentina (11.2%, a difference of 0.22%), and Immigrants from Sri Lanka (11.2%, a difference of 0.23%).
| Demographics | Rating | Rank | No Vehicles in Household |
| Crow | 14.2 /100 | #211 | Poor 11.0% |
| Immigrants | Western Asia | 13.9 /100 | #212 | Poor 11.0% |
| Immigrants | Hungary | 12.3 /100 | #213 | Poor 11.1% |
| Immigrants | Denmark | 12.1 /100 | #214 | Poor 11.1% |
| Immigrants | Sri Lanka | 10.6 /100 | #215 | Poor 11.2% |
| Immigrants | Argentina | 10.6 /100 | #216 | Poor 11.2% |
| Dutch West Indians | 10.2 /100 | #217 | Poor 11.2% |
| Immigrants | Guatemala | 10.0 /100 | #218 | Tragic 11.2% |
| Argentineans | 9.6 /100 | #219 | Tragic 11.2% |
| Immigrants | Zaire | 9.6 /100 | #220 | Tragic 11.2% |
| Peruvians | 8.4 /100 | #221 | Tragic 11.2% |
| Immigrants | South America | 8.0 /100 | #222 | Tragic 11.3% |
| Uruguayans | 7.7 /100 | #223 | Tragic 11.3% |
| Immigrants | Hong Kong | 7.2 /100 | #224 | Tragic 11.3% |
| Immigrants | Sierra Leone | 6.4 /100 | #225 | Tragic 11.3% |