Immigrants from Netherlands vs Menominee No Vehicles in Household
COMPARE
Immigrants from Netherlands
Menominee
No Vehicles in Household
No Vehicles in Household Comparison
Immigrants from Netherlands
Menominee
9.4%
NO VEHICLES IN HOUSEHOLD
94.8/ 100
METRIC RATING
113th/ 347
METRIC RANK
11.8%
NO VEHICLES IN HOUSEHOLD
2.0/ 100
METRIC RATING
246th/ 347
METRIC RANK
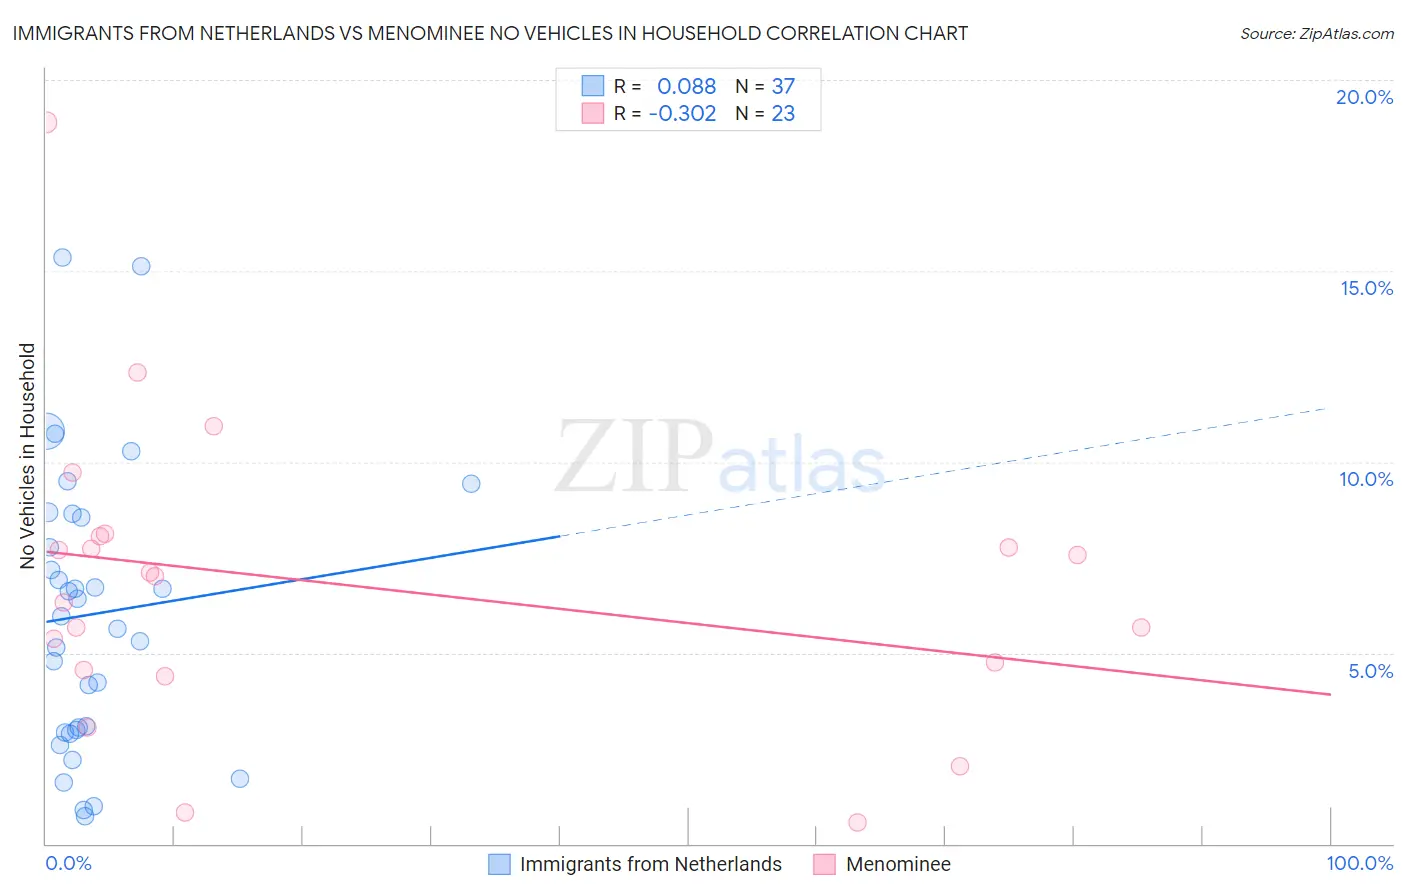
Immigrants from Netherlands vs Menominee No Vehicles in Household Correlation Chart
The statistical analysis conducted on geographies consisting of 237,498,121 people shows a slight positive correlation between the proportion of Immigrants from Netherlands and percentage of households with no vehicle available in the United States with a correlation coefficient (R) of 0.088 and weighted average of 9.4%. Similarly, the statistical analysis conducted on geographies consisting of 45,769,644 people shows a mild negative correlation between the proportion of Menominee and percentage of households with no vehicle available in the United States with a correlation coefficient (R) of -0.302 and weighted average of 11.8%, a difference of 25.6%.
No Vehicles in Household Correlation Summary
| Measurement | Immigrants from Netherlands | Menominee |
| Minimum | 0.72% | 0.55% |
| Maximum | 15.4% | 18.9% |
| Range | 14.6% | 18.3% |
| Mean | 6.0% | 6.8% |
| Median | 5.9% | 7.0% |
| Interquartile 25% (IQ1) | 2.9% | 4.5% |
| Interquartile 75% (IQ3) | 8.6% | 8.1% |
| Interquartile Range (IQR) | 5.7% | 3.5% |
| Standard Deviation (Sample) | 3.7% | 3.9% |
| Standard Deviation (Population) | 3.6% | 3.8% |
Similar Demographics by No Vehicles in Household
Demographics Similar to Immigrants from Netherlands by No Vehicles in Household
In terms of no vehicles in household, the demographic groups most similar to Immigrants from Netherlands are Armenian (9.4%, a difference of 0.10%), Immigrants from Kuwait (9.4%, a difference of 0.18%), Serbian (9.4%, a difference of 0.43%), Navajo (9.4%, a difference of 0.49%), and Japanese (9.4%, a difference of 0.56%).
| Demographics | Rating | Rank | No Vehicles in Household |
| Laotians | 97.8 /100 | #106 | Exceptional 9.1% |
| Hispanics or Latinos | 97.7 /100 | #107 | Exceptional 9.1% |
| Mexican American Indians | 97.6 /100 | #108 | Exceptional 9.1% |
| Maltese | 97.6 /100 | #109 | Exceptional 9.1% |
| Delaware | 97.2 /100 | #110 | Exceptional 9.2% |
| Immigrants | Kuwait | 95.1 /100 | #111 | Exceptional 9.4% |
| Armenians | 95.0 /100 | #112 | Exceptional 9.4% |
| Immigrants | Netherlands | 94.8 /100 | #113 | Exceptional 9.4% |
| Serbians | 94.3 /100 | #114 | Exceptional 9.4% |
| Navajo | 94.2 /100 | #115 | Exceptional 9.4% |
| Japanese | 94.1 /100 | #116 | Exceptional 9.4% |
| Chippewa | 93.8 /100 | #117 | Exceptional 9.4% |
| Greeks | 92.9 /100 | #118 | Exceptional 9.5% |
| Fijians | 92.7 /100 | #119 | Exceptional 9.5% |
| Immigrants | Thailand | 92.6 /100 | #120 | Exceptional 9.5% |
Demographics Similar to Menominee by No Vehicles in Household
In terms of no vehicles in household, the demographic groups most similar to Menominee are Immigrants from Czechoslovakia (11.8%, a difference of 0.050%), Immigrants from Belgium (11.8%, a difference of 0.060%), Immigrants from Nigeria (11.8%, a difference of 0.10%), Immigrants from Honduras (11.8%, a difference of 0.17%), and Paiute (11.8%, a difference of 0.32%).
| Demographics | Rating | Rank | No Vehicles in Household |
| Taiwanese | 2.8 /100 | #239 | Tragic 11.7% |
| Immigrants | Immigrants | 2.7 /100 | #240 | Tragic 11.7% |
| Eastern Europeans | 2.7 /100 | #241 | Tragic 11.7% |
| Turks | 2.6 /100 | #242 | Tragic 11.7% |
| Cheyenne | 2.4 /100 | #243 | Tragic 11.7% |
| Immigrants | Portugal | 2.2 /100 | #244 | Tragic 11.7% |
| Immigrants | Honduras | 2.1 /100 | #245 | Tragic 11.8% |
| Menominee | 2.0 /100 | #246 | Tragic 11.8% |
| Immigrants | Czechoslovakia | 2.0 /100 | #247 | Tragic 11.8% |
| Immigrants | Belgium | 1.9 /100 | #248 | Tragic 11.8% |
| Immigrants | Nigeria | 1.9 /100 | #249 | Tragic 11.8% |
| Paiute | 1.8 /100 | #250 | Tragic 11.8% |
| Blacks/African Americans | 1.6 /100 | #251 | Tragic 11.9% |
| Immigrants | Serbia | 1.5 /100 | #252 | Tragic 11.9% |
| Egyptians | 1.4 /100 | #253 | Tragic 11.9% |