Immigrants from Micronesia vs Immigrants from Oceania No Vehicles in Household
COMPARE
Immigrants from Micronesia
Immigrants from Oceania
No Vehicles in Household
No Vehicles in Household Comparison
Immigrants from Micronesia
Immigrants from Oceania
10.1%
NO VEHICLES IN HOUSEHOLD
70.9/ 100
METRIC RATING
156th/ 347
METRIC RANK
9.7%
NO VEHICLES IN HOUSEHOLD
87.1/ 100
METRIC RATING
133rd/ 347
METRIC RANK
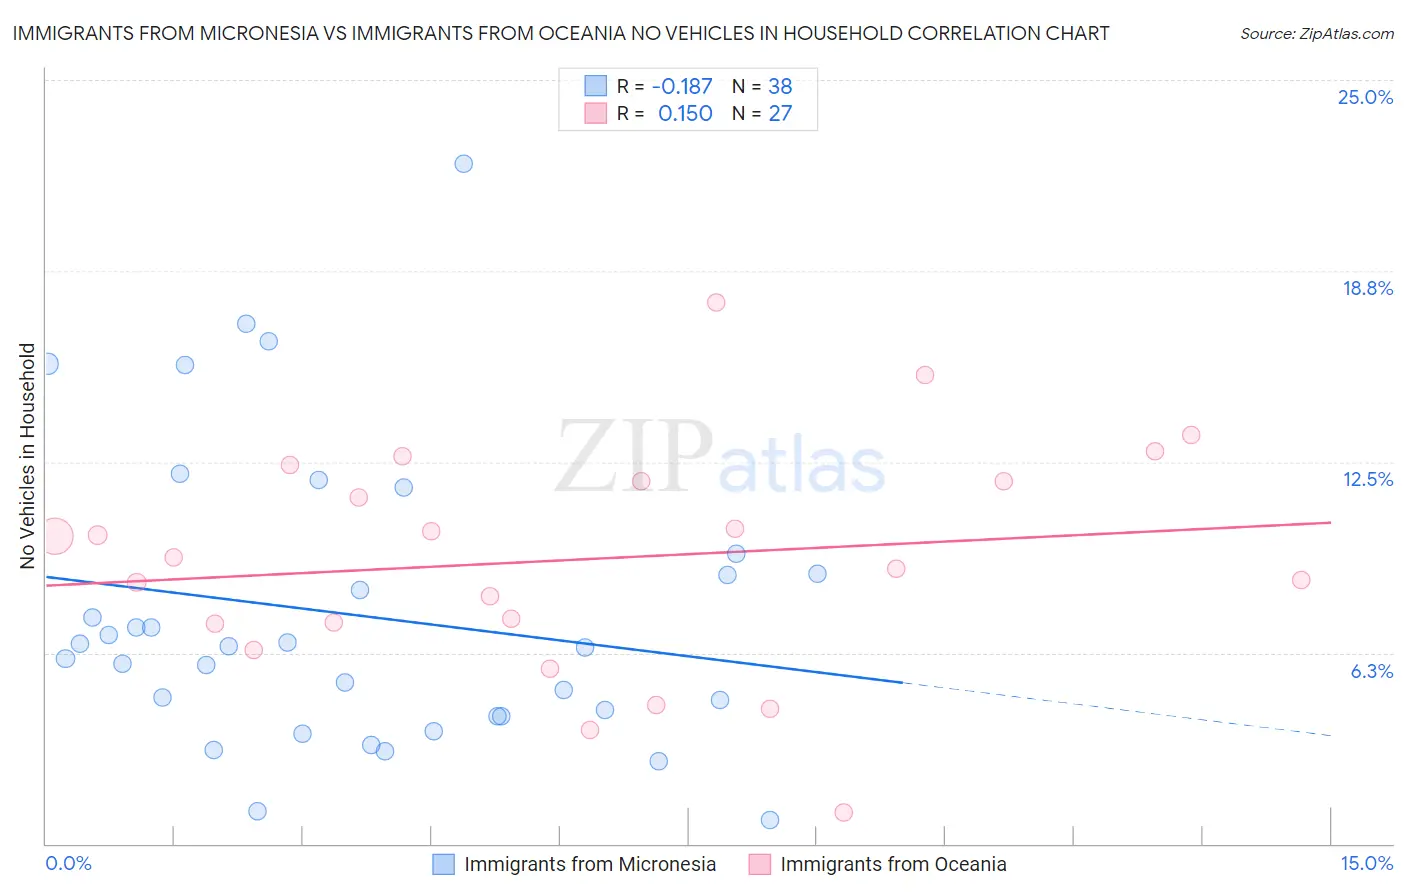
Immigrants from Micronesia vs Immigrants from Oceania No Vehicles in Household Correlation Chart
The statistical analysis conducted on geographies consisting of 61,571,663 people shows a poor negative correlation between the proportion of Immigrants from Micronesia and percentage of households with no vehicle available in the United States with a correlation coefficient (R) of -0.187 and weighted average of 10.1%. Similarly, the statistical analysis conducted on geographies consisting of 304,786,769 people shows a poor positive correlation between the proportion of Immigrants from Oceania and percentage of households with no vehicle available in the United States with a correlation coefficient (R) of 0.150 and weighted average of 9.7%, a difference of 3.7%.
No Vehicles in Household Correlation Summary
| Measurement | Immigrants from Micronesia | Immigrants from Oceania |
| Minimum | 0.77% | 1.0% |
| Maximum | 22.3% | 17.7% |
| Range | 21.5% | 16.7% |
| Mean | 7.5% | 9.3% |
| Median | 6.4% | 9.4% |
| Interquartile 25% (IQ1) | 4.2% | 7.2% |
| Interquartile 75% (IQ3) | 8.8% | 11.9% |
| Interquartile Range (IQR) | 4.7% | 4.7% |
| Standard Deviation (Sample) | 4.8% | 3.7% |
| Standard Deviation (Population) | 4.7% | 3.6% |
Similar Demographics by No Vehicles in Household
Demographics Similar to Immigrants from Micronesia by No Vehicles in Household
In terms of no vehicles in household, the demographic groups most similar to Immigrants from Micronesia are Australian (10.1%, a difference of 0.050%), Spanish American Indian (10.1%, a difference of 0.11%), Salvadoran (10.1%, a difference of 0.25%), Immigrants from Indonesia (10.1%, a difference of 0.26%), and Sioux (10.1%, a difference of 0.27%).
| Demographics | Rating | Rank | No Vehicles in Household |
| Immigrants | Uganda | 76.1 /100 | #149 | Good 10.0% |
| Colombians | 73.9 /100 | #150 | Good 10.0% |
| Immigrants | Eastern Africa | 73.8 /100 | #151 | Good 10.0% |
| Immigrants | Congo | 73.0 /100 | #152 | Good 10.1% |
| Tlingit-Haida | 72.5 /100 | #153 | Good 10.1% |
| Sioux | 72.4 /100 | #154 | Good 10.1% |
| Salvadorans | 72.4 /100 | #155 | Good 10.1% |
| Immigrants | Micronesia | 70.9 /100 | #156 | Good 10.1% |
| Australians | 70.6 /100 | #157 | Good 10.1% |
| Spanish American Indians | 70.2 /100 | #158 | Good 10.1% |
| Immigrants | Indonesia | 69.3 /100 | #159 | Good 10.1% |
| Immigrants | Middle Africa | 65.7 /100 | #160 | Good 10.2% |
| New Zealanders | 65.1 /100 | #161 | Good 10.2% |
| Immigrants | Austria | 64.4 /100 | #162 | Good 10.2% |
| Immigrants | Cambodia | 63.7 /100 | #163 | Good 10.2% |
Demographics Similar to Immigrants from Oceania by No Vehicles in Household
In terms of no vehicles in household, the demographic groups most similar to Immigrants from Oceania are Syrian (9.7%, a difference of 0.020%), Kenyan (9.7%, a difference of 0.30%), Immigrants from the Azores (9.7%, a difference of 0.37%), Burmese (9.7%, a difference of 0.58%), and Latvian (9.8%, a difference of 0.60%).
| Demographics | Rating | Rank | No Vehicles in Household |
| Icelanders | 90.2 /100 | #126 | Exceptional 9.6% |
| Immigrants | Kenya | 89.7 /100 | #127 | Excellent 9.6% |
| Immigrants | Syria | 89.5 /100 | #128 | Excellent 9.6% |
| Nicaraguans | 89.5 /100 | #129 | Excellent 9.7% |
| Burmese | 88.8 /100 | #130 | Excellent 9.7% |
| Immigrants | Azores | 88.2 /100 | #131 | Excellent 9.7% |
| Kenyans | 88.0 /100 | #132 | Excellent 9.7% |
| Immigrants | Oceania | 87.1 /100 | #133 | Excellent 9.7% |
| Syrians | 87.1 /100 | #134 | Excellent 9.7% |
| Latvians | 85.1 /100 | #135 | Excellent 9.8% |
| Immigrants | South Africa | 85.0 /100 | #136 | Excellent 9.8% |
| Immigrants | Moldova | 84.6 /100 | #137 | Excellent 9.8% |
| Estonians | 84.2 /100 | #138 | Excellent 9.8% |
| Marshallese | 84.0 /100 | #139 | Excellent 9.8% |
| Immigrants | Lithuania | 84.0 /100 | #140 | Excellent 9.8% |