Immigrants from Korea vs Immigrants from Venezuela No Vehicles in Household
COMPARE
Immigrants from Korea
Immigrants from Venezuela
No Vehicles in Household
No Vehicles in Household Comparison
Immigrants from Korea
Immigrants from Venezuela
9.6%
NO VEHICLES IN HOUSEHOLD
90.9/ 100
METRIC RATING
124th/ 347
METRIC RANK
8.1%
NO VEHICLES IN HOUSEHOLD
99.9/ 100
METRIC RATING
54th/ 347
METRIC RANK
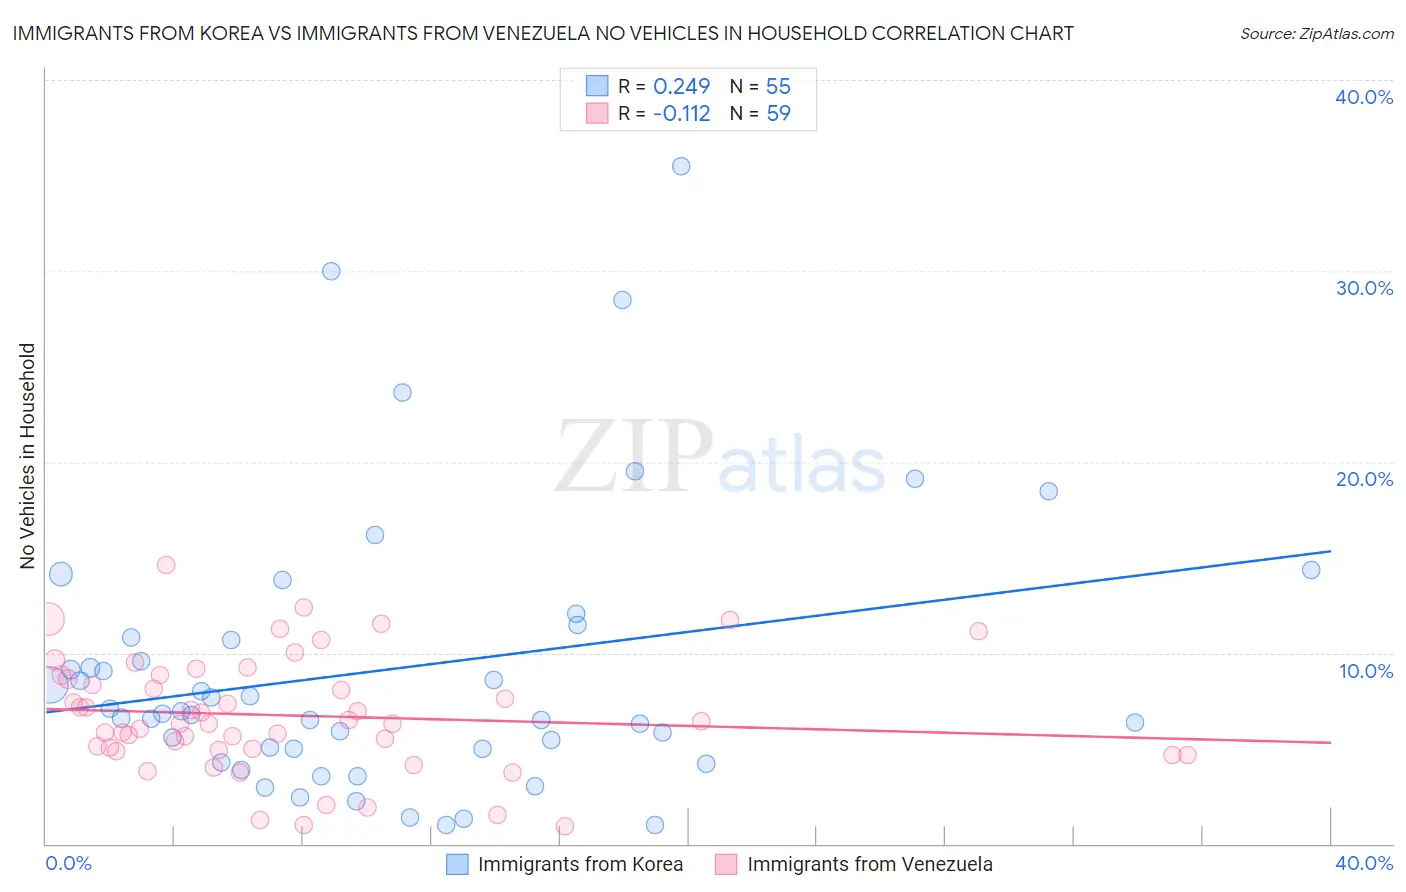
Immigrants from Korea vs Immigrants from Venezuela No Vehicles in Household Correlation Chart
The statistical analysis conducted on geographies consisting of 415,000,700 people shows a weak positive correlation between the proportion of Immigrants from Korea and percentage of households with no vehicle available in the United States with a correlation coefficient (R) of 0.249 and weighted average of 9.6%. Similarly, the statistical analysis conducted on geographies consisting of 287,495,682 people shows a poor negative correlation between the proportion of Immigrants from Venezuela and percentage of households with no vehicle available in the United States with a correlation coefficient (R) of -0.112 and weighted average of 8.1%, a difference of 19.0%.
No Vehicles in Household Correlation Summary
| Measurement | Immigrants from Korea | Immigrants from Venezuela |
| Minimum | 0.98% | 0.90% |
| Maximum | 35.5% | 14.6% |
| Range | 34.5% | 13.7% |
| Mean | 9.1% | 6.7% |
| Median | 6.8% | 6.3% |
| Interquartile 25% (IQ1) | 5.0% | 4.9% |
| Interquartile 75% (IQ3) | 10.8% | 8.8% |
| Interquartile Range (IQR) | 5.8% | 3.9% |
| Standard Deviation (Sample) | 7.3% | 3.0% |
| Standard Deviation (Population) | 7.2% | 3.0% |
Similar Demographics by No Vehicles in Household
Demographics Similar to Immigrants from Korea by No Vehicles in Household
In terms of no vehicles in household, the demographic groups most similar to Immigrants from Korea are Immigrants from Cameroon (9.6%, a difference of 0.13%), Blackfeet (9.6%, a difference of 0.23%), Icelander (9.6%, a difference of 0.30%), Immigrants from Kenya (9.6%, a difference of 0.48%), and Immigrants from Syria (9.6%, a difference of 0.56%).
| Demographics | Rating | Rank | No Vehicles in Household |
| Chippewa | 93.8 /100 | #117 | Exceptional 9.4% |
| Greeks | 92.9 /100 | #118 | Exceptional 9.5% |
| Fijians | 92.7 /100 | #119 | Exceptional 9.5% |
| Immigrants | Thailand | 92.6 /100 | #120 | Exceptional 9.5% |
| Puget Sound Salish | 92.4 /100 | #121 | Exceptional 9.5% |
| Costa Ricans | 92.3 /100 | #122 | Exceptional 9.5% |
| Blackfeet | 91.4 /100 | #123 | Exceptional 9.6% |
| Immigrants | Korea | 90.9 /100 | #124 | Exceptional 9.6% |
| Immigrants | Cameroon | 90.6 /100 | #125 | Exceptional 9.6% |
| Icelanders | 90.2 /100 | #126 | Exceptional 9.6% |
| Immigrants | Kenya | 89.7 /100 | #127 | Excellent 9.6% |
| Immigrants | Syria | 89.5 /100 | #128 | Excellent 9.6% |
| Nicaraguans | 89.5 /100 | #129 | Excellent 9.7% |
| Burmese | 88.8 /100 | #130 | Excellent 9.7% |
| Immigrants | Azores | 88.2 /100 | #131 | Excellent 9.7% |
Demographics Similar to Immigrants from Venezuela by No Vehicles in Household
In terms of no vehicles in household, the demographic groups most similar to Immigrants from Venezuela are Celtic (8.1%, a difference of 0.090%), Hawaiian (8.0%, a difference of 0.31%), Slovene (8.0%, a difference of 0.31%), Immigrants from Afghanistan (8.1%, a difference of 0.48%), and Venezuelan (8.1%, a difference of 0.77%).
| Demographics | Rating | Rank | No Vehicles in Household |
| Northern Europeans | 99.9 /100 | #47 | Exceptional 7.9% |
| Afghans | 99.9 /100 | #48 | Exceptional 8.0% |
| Guamanians/Chamorros | 99.9 /100 | #49 | Exceptional 8.0% |
| Belgians | 99.9 /100 | #50 | Exceptional 8.0% |
| Koreans | 99.9 /100 | #51 | Exceptional 8.0% |
| Hawaiians | 99.9 /100 | #52 | Exceptional 8.0% |
| Slovenes | 99.9 /100 | #53 | Exceptional 8.0% |
| Immigrants | Venezuela | 99.9 /100 | #54 | Exceptional 8.1% |
| Celtics | 99.9 /100 | #55 | Exceptional 8.1% |
| Immigrants | Afghanistan | 99.9 /100 | #56 | Exceptional 8.1% |
| Venezuelans | 99.8 /100 | #57 | Exceptional 8.1% |
| Immigrants | Mexico | 99.8 /100 | #58 | Exceptional 8.1% |
| Immigrants | India | 99.8 /100 | #59 | Exceptional 8.2% |
| Immigrants | Laos | 99.8 /100 | #60 | Exceptional 8.2% |
| Thais | 99.8 /100 | #61 | Exceptional 8.2% |