Immigrants from Ireland vs Immigrants from Scotland No Vehicles in Household
COMPARE
Immigrants from Ireland
Immigrants from Scotland
No Vehicles in Household
No Vehicles in Household Comparison
Immigrants from Ireland
Immigrants from Scotland
13.7%
NO VEHICLES IN HOUSEHOLD
0.0/ 100
METRIC RATING
287th/ 347
METRIC RANK
8.3%
NO VEHICLES IN HOUSEHOLD
99.7/ 100
METRIC RATING
67th/ 347
METRIC RANK
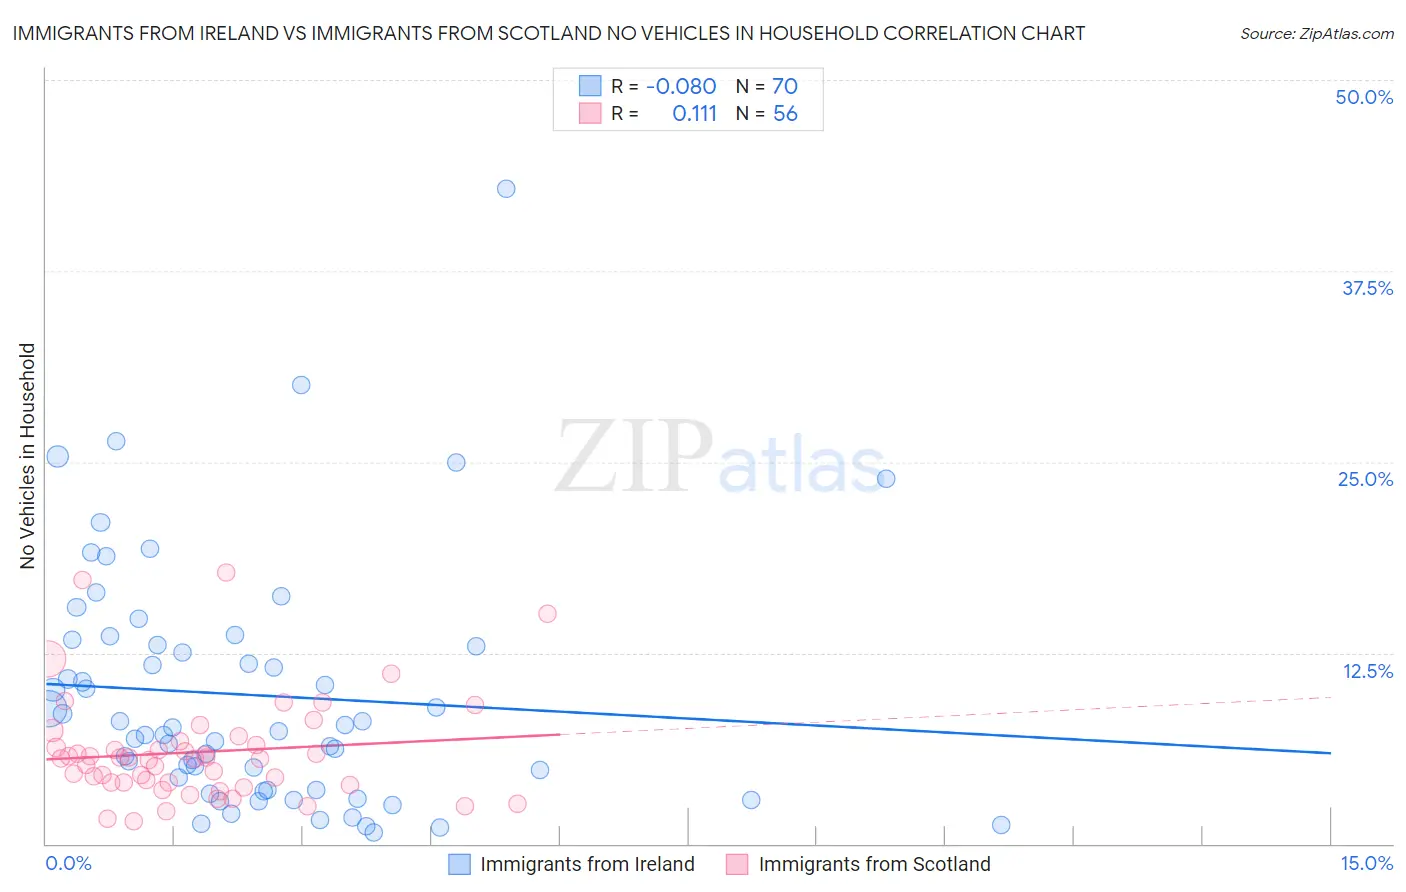
Immigrants from Ireland vs Immigrants from Scotland No Vehicles in Household Correlation Chart
The statistical analysis conducted on geographies consisting of 240,526,628 people shows a slight negative correlation between the proportion of Immigrants from Ireland and percentage of households with no vehicle available in the United States with a correlation coefficient (R) of -0.080 and weighted average of 13.7%. Similarly, the statistical analysis conducted on geographies consisting of 196,071,616 people shows a poor positive correlation between the proportion of Immigrants from Scotland and percentage of households with no vehicle available in the United States with a correlation coefficient (R) of 0.111 and weighted average of 8.3%, a difference of 64.6%.
No Vehicles in Household Correlation Summary
| Measurement | Immigrants from Ireland | Immigrants from Scotland |
| Minimum | 0.75% | 1.4% |
| Maximum | 42.9% | 17.7% |
| Range | 42.1% | 16.3% |
| Mean | 9.7% | 6.0% |
| Median | 7.5% | 5.6% |
| Interquartile 25% (IQ1) | 3.5% | 4.0% |
| Interquartile 75% (IQ3) | 13.0% | 6.6% |
| Interquartile Range (IQR) | 9.5% | 2.6% |
| Standard Deviation (Sample) | 8.0% | 3.4% |
| Standard Deviation (Population) | 7.9% | 3.4% |
Similar Demographics by No Vehicles in Household
Demographics Similar to Immigrants from Ireland by No Vehicles in Household
In terms of no vehicles in household, the demographic groups most similar to Immigrants from Ireland are Hopi (13.7%, a difference of 0.13%), Colville (13.7%, a difference of 0.21%), Immigrants from Australia (13.8%, a difference of 0.80%), Immigrants from Eastern Europe (13.6%, a difference of 0.87%), and Immigrants from Malaysia (13.6%, a difference of 0.92%).
| Demographics | Rating | Rank | No Vehicles in Household |
| Alsatians | 0.0 /100 | #280 | Tragic 13.2% |
| Central American Indians | 0.0 /100 | #281 | Tragic 13.3% |
| Immigrants | Eastern Asia | 0.0 /100 | #282 | Tragic 13.5% |
| Immigrants | Kazakhstan | 0.0 /100 | #283 | Tragic 13.6% |
| Immigrants | Malaysia | 0.0 /100 | #284 | Tragic 13.6% |
| Immigrants | Eastern Europe | 0.0 /100 | #285 | Tragic 13.6% |
| Colville | 0.0 /100 | #286 | Tragic 13.7% |
| Immigrants | Ireland | 0.0 /100 | #287 | Tragic 13.7% |
| Hopi | 0.0 /100 | #288 | Tragic 13.7% |
| Immigrants | Australia | 0.0 /100 | #289 | Tragic 13.8% |
| Indians (Asian) | 0.0 /100 | #290 | Tragic 14.1% |
| Okinawans | 0.0 /100 | #291 | Tragic 14.1% |
| Pima | 0.0 /100 | #292 | Tragic 14.1% |
| Immigrants | Jamaica | 0.0 /100 | #293 | Tragic 14.2% |
| Belizeans | 0.0 /100 | #294 | Tragic 14.3% |
Demographics Similar to Immigrants from Scotland by No Vehicles in Household
In terms of no vehicles in household, the demographic groups most similar to Immigrants from Scotland are Palestinian (8.3%, a difference of 0.010%), Canadian (8.3%, a difference of 0.12%), Immigrants from Iran (8.4%, a difference of 0.40%), Spaniard (8.4%, a difference of 0.45%), and Croatian (8.3%, a difference of 0.87%).
| Demographics | Rating | Rank | No Vehicles in Household |
| Immigrants | Laos | 99.8 /100 | #60 | Exceptional 8.2% |
| Thais | 99.8 /100 | #61 | Exceptional 8.2% |
| Chinese | 99.8 /100 | #62 | Exceptional 8.2% |
| Slovaks | 99.8 /100 | #63 | Exceptional 8.3% |
| Croatians | 99.8 /100 | #64 | Exceptional 8.3% |
| Canadians | 99.7 /100 | #65 | Exceptional 8.3% |
| Palestinians | 99.7 /100 | #66 | Exceptional 8.3% |
| Immigrants | Scotland | 99.7 /100 | #67 | Exceptional 8.3% |
| Immigrants | Iran | 99.7 /100 | #68 | Exceptional 8.4% |
| Spaniards | 99.7 /100 | #69 | Exceptional 8.4% |
| Cajuns | 99.6 /100 | #70 | Exceptional 8.4% |
| Immigrants | Lebanon | 99.6 /100 | #71 | Exceptional 8.4% |
| Lithuanians | 99.6 /100 | #72 | Exceptional 8.4% |
| Poles | 99.6 /100 | #73 | Exceptional 8.4% |
| Cubans | 99.5 /100 | #74 | Exceptional 8.5% |