Immigrants from Belarus vs Immigrants from Lebanon 1 or more Vehicles in Household
COMPARE
Immigrants from Belarus
Immigrants from Lebanon
1 or more Vehicles in Household
1 or more Vehicles in Household Comparison
Immigrants from Belarus
Immigrants from Lebanon
83.3%
1 OR MORE VEHICLES IN HOUSEHOLD
0.0/ 100
METRIC RATING
319th/ 347
METRIC RANK
91.6%
1 OR MORE VEHICLES IN HOUSEHOLD
99.6/ 100
METRIC RATING
74th/ 347
METRIC RANK
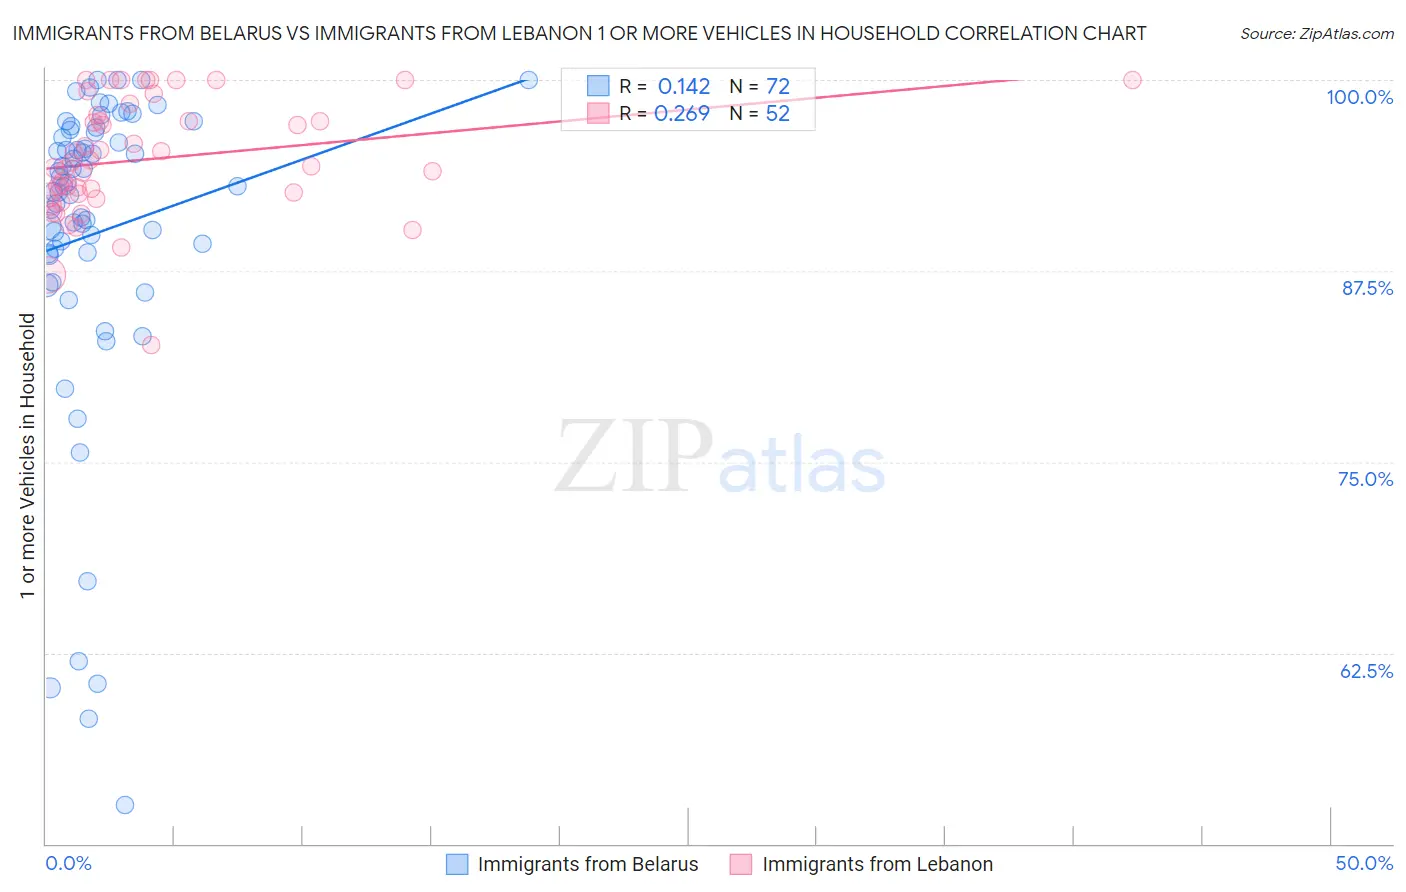
Immigrants from Belarus vs Immigrants from Lebanon 1 or more Vehicles in Household Correlation Chart
The statistical analysis conducted on geographies consisting of 150,124,439 people shows a poor positive correlation between the proportion of Immigrants from Belarus and percentage of households with 1 or more vehicles available in the United States with a correlation coefficient (R) of 0.142 and weighted average of 83.3%. Similarly, the statistical analysis conducted on geographies consisting of 216,991,778 people shows a weak positive correlation between the proportion of Immigrants from Lebanon and percentage of households with 1 or more vehicles available in the United States with a correlation coefficient (R) of 0.269 and weighted average of 91.6%, a difference of 10.0%.
1 or more Vehicles in Household Correlation Summary
| Measurement | Immigrants from Belarus | Immigrants from Lebanon |
| Minimum | 52.5% | 82.7% |
| Maximum | 100.0% | 100.0% |
| Range | 47.5% | 17.3% |
| Mean | 90.0% | 94.8% |
| Median | 93.1% | 94.5% |
| Interquartile 25% (IQ1) | 88.7% | 92.5% |
| Interquartile 75% (IQ3) | 96.6% | 97.5% |
| Interquartile Range (IQR) | 7.9% | 5.0% |
| Standard Deviation (Sample) | 10.6% | 3.8% |
| Standard Deviation (Population) | 10.5% | 3.8% |
Similar Demographics by 1 or more Vehicles in Household
Demographics Similar to Immigrants from Belarus by 1 or more Vehicles in Household
In terms of 1 or more vehicles in household, the demographic groups most similar to Immigrants from Belarus are Immigrants from Ghana (83.4%, a difference of 0.13%), Ghanaian (83.6%, a difference of 0.34%), Alaska Native (83.8%, a difference of 0.55%), Soviet Union (82.7%, a difference of 0.81%), and Cypriot (84.4%, a difference of 1.3%).
| Demographics | Rating | Rank | 1 or more Vehicles in Household |
| Cape Verdeans | 0.0 /100 | #312 | Tragic 84.5% |
| Immigrants | Israel | 0.0 /100 | #313 | Tragic 84.5% |
| Albanians | 0.0 /100 | #314 | Tragic 84.4% |
| Cypriots | 0.0 /100 | #315 | Tragic 84.4% |
| Alaska Natives | 0.0 /100 | #316 | Tragic 83.8% |
| Ghanaians | 0.0 /100 | #317 | Tragic 83.6% |
| Immigrants | Ghana | 0.0 /100 | #318 | Tragic 83.4% |
| Immigrants | Belarus | 0.0 /100 | #319 | Tragic 83.3% |
| Soviet Union | 0.0 /100 | #320 | Tragic 82.7% |
| Jamaicans | 0.0 /100 | #321 | Tragic 82.1% |
| Immigrants | Cabo Verde | 0.0 /100 | #322 | Tragic 81.6% |
| Immigrants | Yemen | 0.0 /100 | #323 | Tragic 80.5% |
| Immigrants | Caribbean | 0.0 /100 | #324 | Tragic 80.4% |
| Senegalese | 0.0 /100 | #325 | Tragic 80.4% |
| Immigrants | West Indies | 0.0 /100 | #326 | Tragic 79.5% |
Demographics Similar to Immigrants from Lebanon by 1 or more Vehicles in Household
In terms of 1 or more vehicles in household, the demographic groups most similar to Immigrants from Lebanon are Immigrants from Iran (91.7%, a difference of 0.030%), Polish (91.7%, a difference of 0.050%), Cajun (91.7%, a difference of 0.050%), Lithuanian (91.7%, a difference of 0.070%), and Palestinian (91.7%, a difference of 0.080%).
| Demographics | Rating | Rank | 1 or more Vehicles in Household |
| Spaniards | 99.8 /100 | #67 | Exceptional 91.8% |
| Immigrants | Scotland | 99.7 /100 | #68 | Exceptional 91.8% |
| Palestinians | 99.7 /100 | #69 | Exceptional 91.7% |
| Lithuanians | 99.7 /100 | #70 | Exceptional 91.7% |
| Poles | 99.7 /100 | #71 | Exceptional 91.7% |
| Cajuns | 99.7 /100 | #72 | Exceptional 91.7% |
| Immigrants | Iran | 99.7 /100 | #73 | Exceptional 91.7% |
| Immigrants | Lebanon | 99.6 /100 | #74 | Exceptional 91.6% |
| Portuguese | 99.5 /100 | #75 | Exceptional 91.6% |
| Cubans | 99.5 /100 | #76 | Exceptional 91.5% |
| Immigrants | Philippines | 99.4 /100 | #77 | Exceptional 91.5% |
| Iranians | 99.4 /100 | #78 | Exceptional 91.5% |
| Immigrants | South Central Asia | 99.4 /100 | #79 | Exceptional 91.5% |
| Bolivians | 99.4 /100 | #80 | Exceptional 91.5% |
| Immigrants | South Eastern Asia | 99.3 /100 | #81 | Exceptional 91.4% |