Fijian vs Dominican No Vehicles in Household
COMPARE
Fijian
Dominican
No Vehicles in Household
No Vehicles in Household Comparison
Fijians
Dominicans
9.5%
NO VEHICLES IN HOUSEHOLD
92.7/ 100
METRIC RATING
119th/ 347
METRIC RANK
29.4%
NO VEHICLES IN HOUSEHOLD
0.0/ 100
METRIC RATING
339th/ 347
METRIC RANK
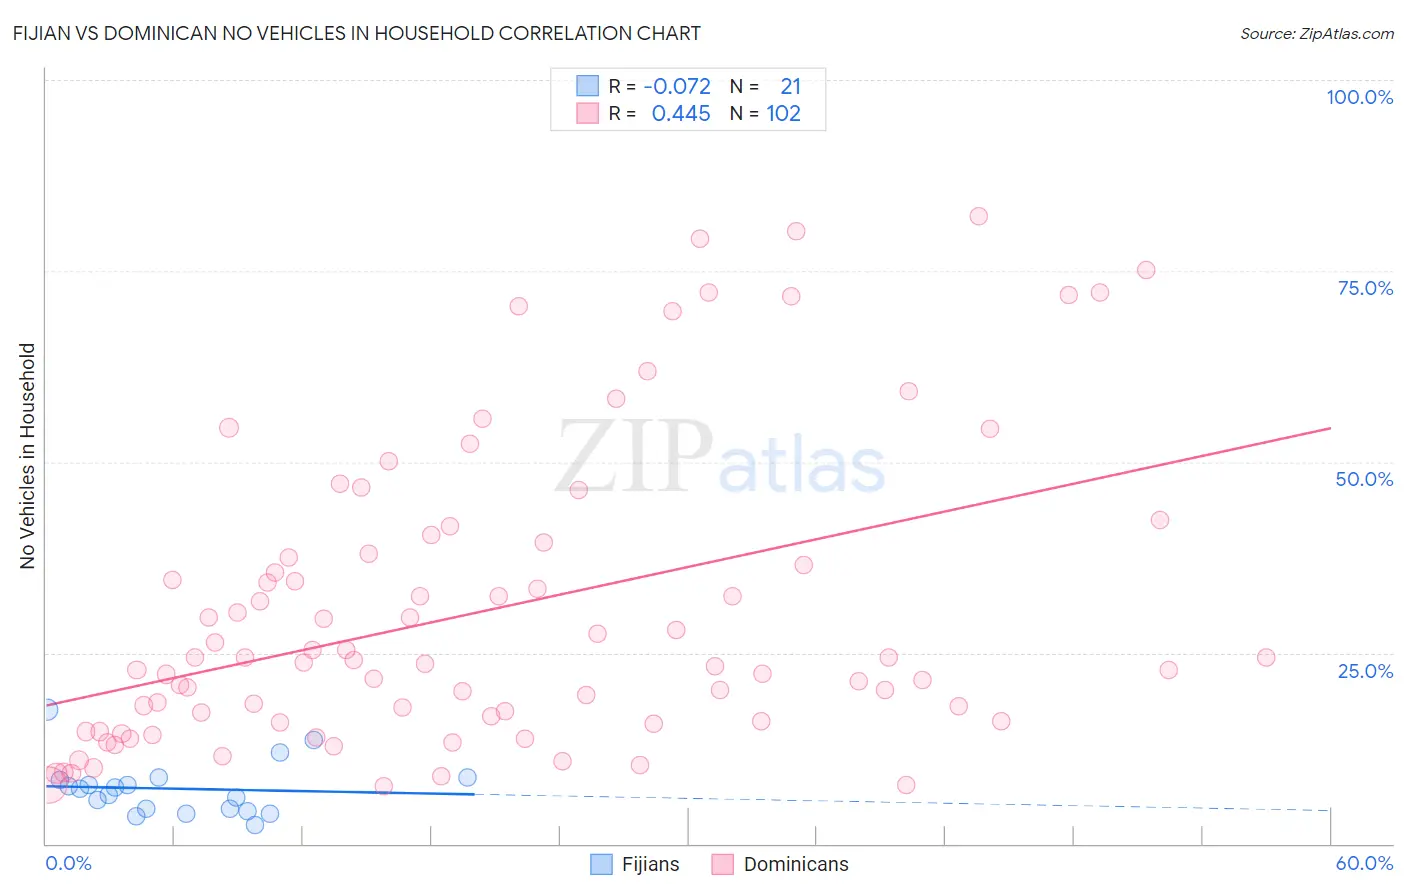
Fijian vs Dominican No Vehicles in Household Correlation Chart
The statistical analysis conducted on geographies consisting of 55,930,698 people shows a slight negative correlation between the proportion of Fijians and percentage of households with no vehicle available in the United States with a correlation coefficient (R) of -0.072 and weighted average of 9.5%. Similarly, the statistical analysis conducted on geographies consisting of 354,220,485 people shows a moderate positive correlation between the proportion of Dominicans and percentage of households with no vehicle available in the United States with a correlation coefficient (R) of 0.445 and weighted average of 29.4%, a difference of 209.3%.
No Vehicles in Household Correlation Summary
| Measurement | Fijian | Dominican |
| Minimum | 2.4% | 7.6% |
| Maximum | 17.5% | 82.1% |
| Range | 15.1% | 74.5% |
| Mean | 7.2% | 30.4% |
| Median | 7.2% | 23.8% |
| Interquartile 25% (IQ1) | 4.4% | 16.0% |
| Interquartile 75% (IQ3) | 8.5% | 38.0% |
| Interquartile Range (IQR) | 4.1% | 22.0% |
| Standard Deviation (Sample) | 3.6% | 19.5% |
| Standard Deviation (Population) | 3.5% | 19.4% |
Similar Demographics by No Vehicles in Household
Demographics Similar to Fijians by No Vehicles in Household
In terms of no vehicles in household, the demographic groups most similar to Fijians are Immigrants from Thailand (9.5%, a difference of 0.060%), Greek (9.5%, a difference of 0.11%), Puget Sound Salish (9.5%, a difference of 0.16%), Costa Rican (9.5%, a difference of 0.21%), and Chippewa (9.4%, a difference of 0.66%).
| Demographics | Rating | Rank | No Vehicles in Household |
| Armenians | 95.0 /100 | #112 | Exceptional 9.4% |
| Immigrants | Netherlands | 94.8 /100 | #113 | Exceptional 9.4% |
| Serbians | 94.3 /100 | #114 | Exceptional 9.4% |
| Navajo | 94.2 /100 | #115 | Exceptional 9.4% |
| Japanese | 94.1 /100 | #116 | Exceptional 9.4% |
| Chippewa | 93.8 /100 | #117 | Exceptional 9.4% |
| Greeks | 92.9 /100 | #118 | Exceptional 9.5% |
| Fijians | 92.7 /100 | #119 | Exceptional 9.5% |
| Immigrants | Thailand | 92.6 /100 | #120 | Exceptional 9.5% |
| Puget Sound Salish | 92.4 /100 | #121 | Exceptional 9.5% |
| Costa Ricans | 92.3 /100 | #122 | Exceptional 9.5% |
| Blackfeet | 91.4 /100 | #123 | Exceptional 9.6% |
| Immigrants | Korea | 90.9 /100 | #124 | Exceptional 9.6% |
| Immigrants | Cameroon | 90.6 /100 | #125 | Exceptional 9.6% |
| Icelanders | 90.2 /100 | #126 | Exceptional 9.6% |
Demographics Similar to Dominicans by No Vehicles in Household
In terms of no vehicles in household, the demographic groups most similar to Dominicans are Immigrants from Barbados (29.5%, a difference of 0.23%), Immigrants from Guyana (29.5%, a difference of 0.28%), Guyanese (29.3%, a difference of 0.36%), British West Indian (29.7%, a difference of 1.1%), and Inupiat (29.9%, a difference of 1.5%).
| Demographics | Rating | Rank | No Vehicles in Household |
| Immigrants | Ecuador | 0.0 /100 | #332 | Tragic 23.8% |
| Immigrants | Trinidad and Tobago | 0.0 /100 | #333 | Tragic 24.6% |
| Immigrants | Bangladesh | 0.0 /100 | #334 | Tragic 25.8% |
| Barbadians | 0.0 /100 | #335 | Tragic 26.1% |
| Vietnamese | 0.0 /100 | #336 | Tragic 26.2% |
| Immigrants | Uzbekistan | 0.0 /100 | #337 | Tragic 26.7% |
| Guyanese | 0.0 /100 | #338 | Tragic 29.3% |
| Dominicans | 0.0 /100 | #339 | Tragic 29.4% |
| Immigrants | Barbados | 0.0 /100 | #340 | Tragic 29.5% |
| Immigrants | Guyana | 0.0 /100 | #341 | Tragic 29.5% |
| British West Indians | 0.0 /100 | #342 | Tragic 29.7% |
| Inupiat | 0.0 /100 | #343 | Tragic 29.9% |
| Immigrants | Dominican Republic | 0.0 /100 | #344 | Tragic 31.4% |
| Immigrants | St. Vincent and the Grenadines | 0.0 /100 | #345 | Tragic 35.4% |
| Immigrants | Grenada | 0.0 /100 | #346 | Tragic 37.5% |