Dutch vs Korean No Vehicles in Household
COMPARE
Dutch
Korean
No Vehicles in Household
No Vehicles in Household Comparison
Dutch
Koreans
6.8%
NO VEHICLES IN HOUSEHOLD
100.0/ 100
METRIC RATING
10th/ 347
METRIC RANK
8.0%
NO VEHICLES IN HOUSEHOLD
99.9/ 100
METRIC RATING
51st/ 347
METRIC RANK
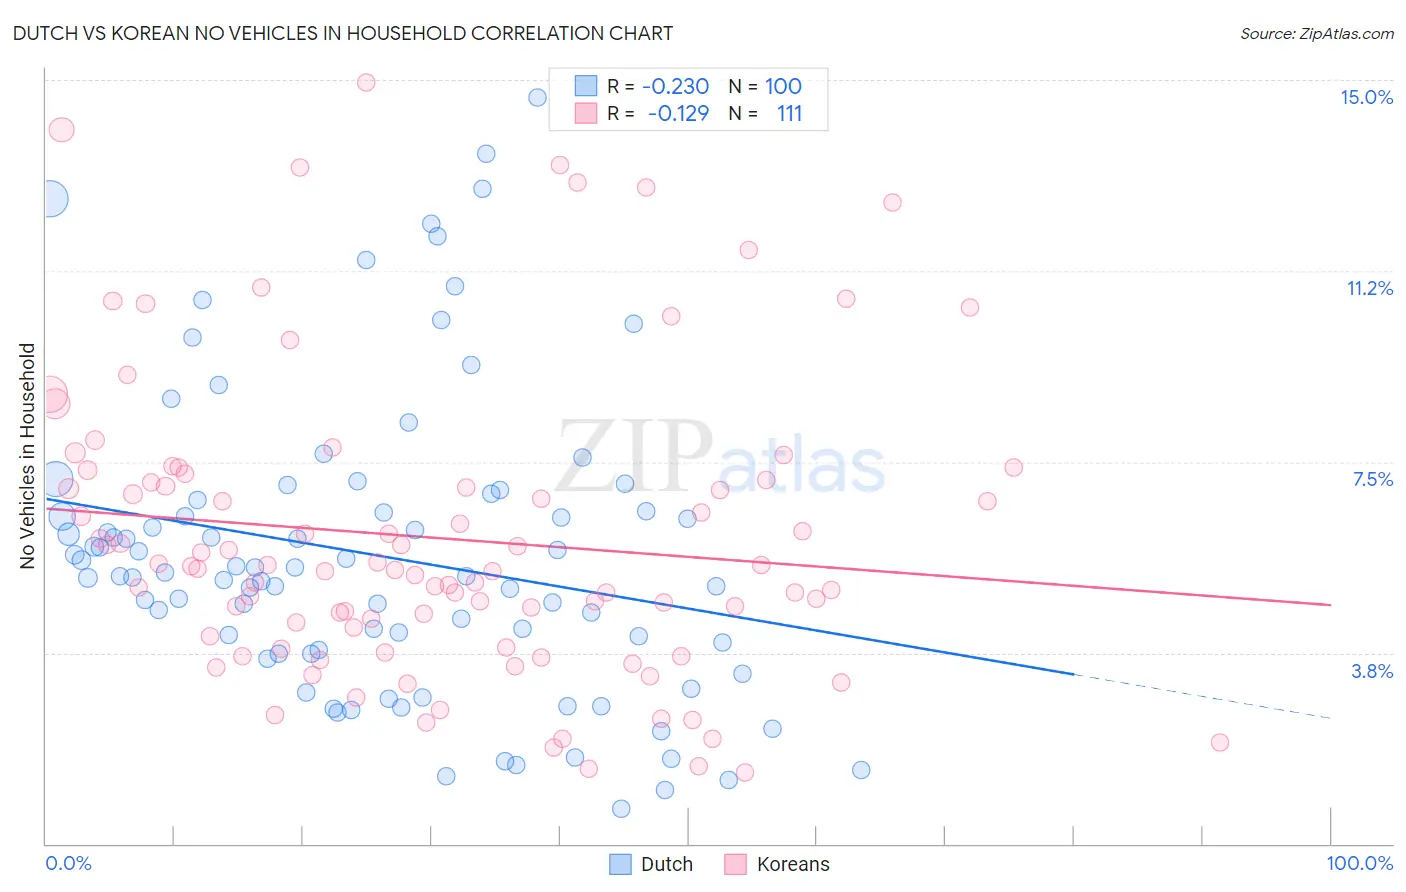
Dutch vs Korean No Vehicles in Household Correlation Chart
The statistical analysis conducted on geographies consisting of 549,648,147 people shows a weak negative correlation between the proportion of Dutch and percentage of households with no vehicle available in the United States with a correlation coefficient (R) of -0.230 and weighted average of 6.8%. Similarly, the statistical analysis conducted on geographies consisting of 508,454,508 people shows a poor negative correlation between the proportion of Koreans and percentage of households with no vehicle available in the United States with a correlation coefficient (R) of -0.129 and weighted average of 8.0%, a difference of 16.8%.
No Vehicles in Household Correlation Summary
| Measurement | Dutch | Korean |
| Minimum | 0.69% | 1.4% |
| Maximum | 14.7% | 14.9% |
| Range | 14.0% | 13.6% |
| Mean | 5.7% | 6.0% |
| Median | 5.3% | 5.4% |
| Interquartile 25% (IQ1) | 3.8% | 4.1% |
| Interquartile 75% (IQ3) | 6.6% | 7.2% |
| Interquartile Range (IQR) | 2.9% | 3.1% |
| Standard Deviation (Sample) | 2.9% | 2.9% |
| Standard Deviation (Population) | 2.9% | 2.9% |
Similar Demographics by No Vehicles in Household
Demographics Similar to Dutch by No Vehicles in Household
In terms of no vehicles in household, the demographic groups most similar to Dutch are Scotch-Irish (6.8%, a difference of 0.51%), Czech (6.9%, a difference of 0.55%), Swedish (6.8%, a difference of 0.72%), Scottish (6.8%, a difference of 1.2%), and Assyrian/Chaldean/Syriac (7.0%, a difference of 2.0%).
| Demographics | Rating | Rank | No Vehicles in Household |
| English | 100.0 /100 | #3 | Exceptional 6.5% |
| Danes | 100.0 /100 | #4 | Exceptional 6.6% |
| Yakama | 100.0 /100 | #5 | Exceptional 6.6% |
| Germans | 100.0 /100 | #6 | Exceptional 6.7% |
| Scottish | 100.0 /100 | #7 | Exceptional 6.8% |
| Swedes | 100.0 /100 | #8 | Exceptional 6.8% |
| Scotch-Irish | 100.0 /100 | #9 | Exceptional 6.8% |
| Dutch | 100.0 /100 | #10 | Exceptional 6.8% |
| Czechs | 100.0 /100 | #11 | Exceptional 6.9% |
| Assyrians/Chaldeans/Syriacs | 100.0 /100 | #12 | Exceptional 7.0% |
| Scandinavians | 100.0 /100 | #13 | Exceptional 7.0% |
| Mexicans | 100.0 /100 | #14 | Exceptional 7.0% |
| Whites/Caucasians | 100.0 /100 | #15 | Exceptional 7.0% |
| Europeans | 100.0 /100 | #16 | Exceptional 7.1% |
| Welsh | 100.0 /100 | #17 | Exceptional 7.2% |
Demographics Similar to Koreans by No Vehicles in Household
In terms of no vehicles in household, the demographic groups most similar to Koreans are Belgian (8.0%, a difference of 0.10%), Guamanian/Chamorro (8.0%, a difference of 0.17%), Afghan (8.0%, a difference of 0.34%), Hawaiian (8.0%, a difference of 0.58%), and Slovene (8.0%, a difference of 0.58%).
| Demographics | Rating | Rank | No Vehicles in Household |
| Choctaw | 99.9 /100 | #44 | Exceptional 7.9% |
| Immigrants | Nonimmigrants | 99.9 /100 | #45 | Exceptional 7.9% |
| Spanish | 99.9 /100 | #46 | Exceptional 7.9% |
| Northern Europeans | 99.9 /100 | #47 | Exceptional 7.9% |
| Afghans | 99.9 /100 | #48 | Exceptional 8.0% |
| Guamanians/Chamorros | 99.9 /100 | #49 | Exceptional 8.0% |
| Belgians | 99.9 /100 | #50 | Exceptional 8.0% |
| Koreans | 99.9 /100 | #51 | Exceptional 8.0% |
| Hawaiians | 99.9 /100 | #52 | Exceptional 8.0% |
| Slovenes | 99.9 /100 | #53 | Exceptional 8.0% |
| Immigrants | Venezuela | 99.9 /100 | #54 | Exceptional 8.1% |
| Celtics | 99.9 /100 | #55 | Exceptional 8.1% |
| Immigrants | Afghanistan | 99.9 /100 | #56 | Exceptional 8.1% |
| Venezuelans | 99.8 /100 | #57 | Exceptional 8.1% |
| Immigrants | Mexico | 99.8 /100 | #58 | Exceptional 8.1% |