Czech vs French No Vehicles in Household
COMPARE
Czech
French
No Vehicles in Household
No Vehicles in Household Comparison
Czechs
French
6.9%
NO VEHICLES IN HOUSEHOLD
100.0/ 100
METRIC RATING
11th/ 347
METRIC RANK
7.4%
NO VEHICLES IN HOUSEHOLD
100.0/ 100
METRIC RATING
23rd/ 347
METRIC RANK
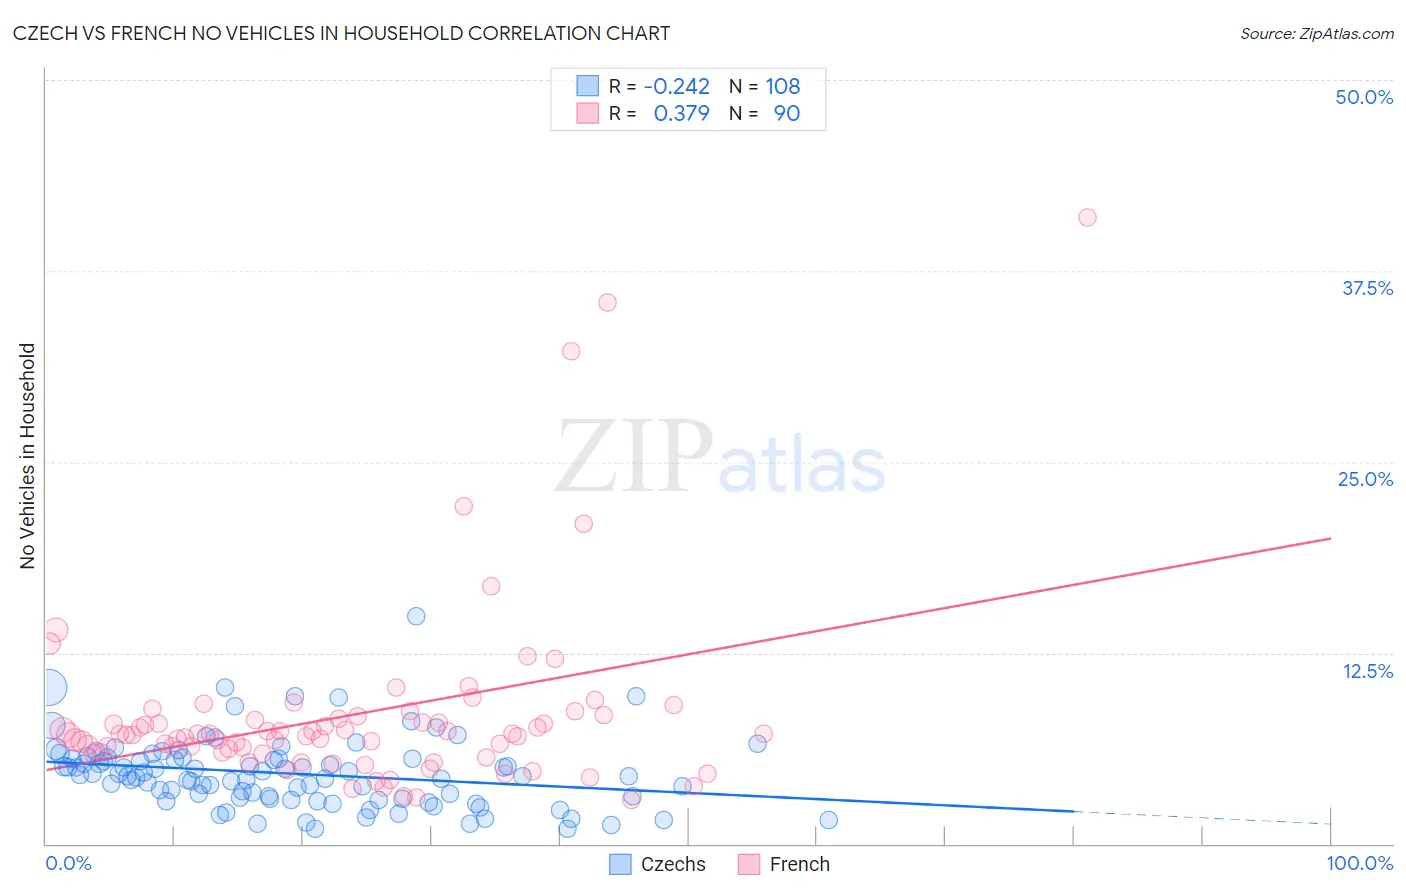
Czech vs French No Vehicles in Household Correlation Chart
The statistical analysis conducted on geographies consisting of 482,256,863 people shows a weak negative correlation between the proportion of Czechs and percentage of households with no vehicle available in the United States with a correlation coefficient (R) of -0.242 and weighted average of 6.9%. Similarly, the statistical analysis conducted on geographies consisting of 566,745,799 people shows a mild positive correlation between the proportion of French and percentage of households with no vehicle available in the United States with a correlation coefficient (R) of 0.379 and weighted average of 7.4%, a difference of 8.1%.
No Vehicles in Household Correlation Summary
| Measurement | Czech | French |
| Minimum | 0.94% | 2.9% |
| Maximum | 14.9% | 41.0% |
| Range | 14.0% | 38.1% |
| Mean | 4.6% | 8.4% |
| Median | 4.4% | 7.1% |
| Interquartile 25% (IQ1) | 3.0% | 6.0% |
| Interquartile 75% (IQ3) | 5.6% | 8.2% |
| Interquartile Range (IQR) | 2.6% | 2.2% |
| Standard Deviation (Sample) | 2.3% | 6.1% |
| Standard Deviation (Population) | 2.3% | 6.1% |
Demographics Similar to Czechs and French by No Vehicles in Household
In terms of no vehicles in household, the demographic groups most similar to Czechs are Dutch (6.8%, a difference of 0.55%), Scotch-Irish (6.8%, a difference of 1.1%), Swedish (6.8%, a difference of 1.3%), Assyrian/Chaldean/Syriac (7.0%, a difference of 1.4%), and Scottish (6.8%, a difference of 1.8%). Similarly, the demographic groups most similar to French are Irish (7.4%, a difference of 0.050%), Immigrants from Iraq (7.5%, a difference of 0.39%), Yaqui (7.5%, a difference of 0.56%), Nepalese (7.4%, a difference of 0.65%), and Ottawa (7.4%, a difference of 0.80%).
| Demographics | Rating | Rank | No Vehicles in Household |
| Scottish | 100.0 /100 | #7 | Exceptional 6.8% |
| Swedes | 100.0 /100 | #8 | Exceptional 6.8% |
| Scotch-Irish | 100.0 /100 | #9 | Exceptional 6.8% |
| Dutch | 100.0 /100 | #10 | Exceptional 6.8% |
| Czechs | 100.0 /100 | #11 | Exceptional 6.9% |
| Assyrians/Chaldeans/Syriacs | 100.0 /100 | #12 | Exceptional 7.0% |
| Scandinavians | 100.0 /100 | #13 | Exceptional 7.0% |
| Mexicans | 100.0 /100 | #14 | Exceptional 7.0% |
| Whites/Caucasians | 100.0 /100 | #15 | Exceptional 7.0% |
| Europeans | 100.0 /100 | #16 | Exceptional 7.1% |
| Welsh | 100.0 /100 | #17 | Exceptional 7.2% |
| Tongans | 100.0 /100 | #18 | Exceptional 7.2% |
| Arapaho | 100.0 /100 | #19 | Exceptional 7.4% |
| Ottawa | 100.0 /100 | #20 | Exceptional 7.4% |
| Nepalese | 100.0 /100 | #21 | Exceptional 7.4% |
| Irish | 100.0 /100 | #22 | Exceptional 7.4% |
| French | 100.0 /100 | #23 | Exceptional 7.4% |
| Immigrants | Iraq | 100.0 /100 | #24 | Exceptional 7.5% |
| Yaqui | 100.0 /100 | #25 | Exceptional 7.5% |
| Sri Lankans | 100.0 /100 | #26 | Exceptional 7.6% |
| British | 100.0 /100 | #27 | Exceptional 7.6% |