Cherokee vs Seminole 1 or more Vehicles in Household
COMPARE
Cherokee
Seminole
1 or more Vehicles in Household
1 or more Vehicles in Household Comparison
Cherokee
Seminole
92.4%
1 OR MORE VEHICLES IN HOUSEHOLD
100.0/ 100
METRIC RATING
33rd/ 347
METRIC RANK
91.1%
1 OR MORE VEHICLES IN HOUSEHOLD
98.3/ 100
METRIC RATING
102nd/ 347
METRIC RANK
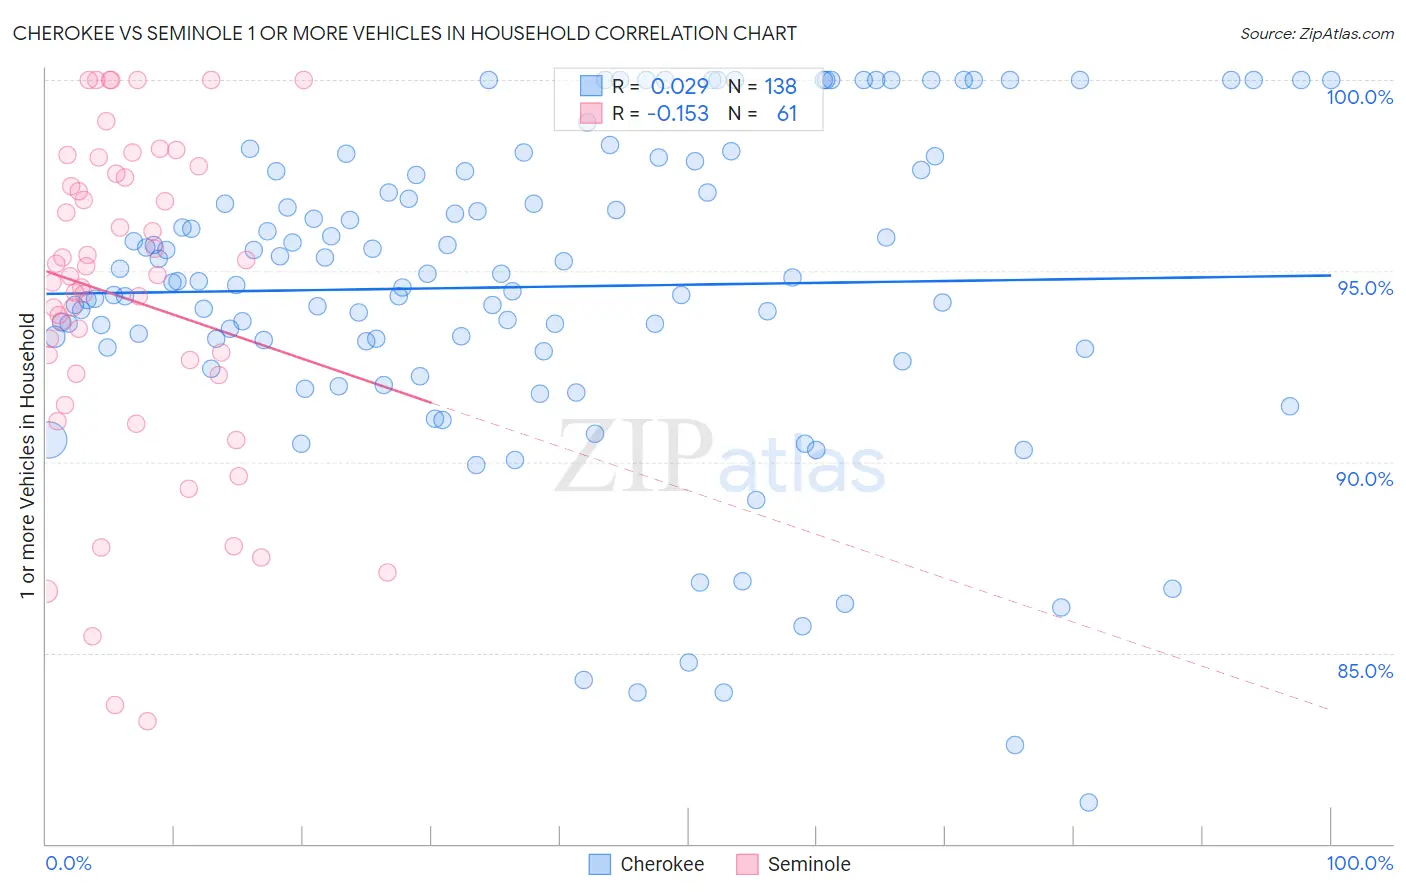
Cherokee vs Seminole 1 or more Vehicles in Household Correlation Chart
The statistical analysis conducted on geographies consisting of 493,431,899 people shows no correlation between the proportion of Cherokee and percentage of households with 1 or more vehicles available in the United States with a correlation coefficient (R) of 0.029 and weighted average of 92.4%. Similarly, the statistical analysis conducted on geographies consisting of 118,307,122 people shows a poor negative correlation between the proportion of Seminole and percentage of households with 1 or more vehicles available in the United States with a correlation coefficient (R) of -0.153 and weighted average of 91.1%, a difference of 1.4%.
1 or more Vehicles in Household Correlation Summary
| Measurement | Cherokee | Seminole |
| Minimum | 81.1% | 83.2% |
| Maximum | 100.0% | 100.0% |
| Range | 18.9% | 16.8% |
| Mean | 94.6% | 94.3% |
| Median | 94.7% | 94.8% |
| Interquartile 25% (IQ1) | 93.0% | 92.3% |
| Interquartile 75% (IQ3) | 97.6% | 97.5% |
| Interquartile Range (IQR) | 4.6% | 5.2% |
| Standard Deviation (Sample) | 4.1% | 4.2% |
| Standard Deviation (Population) | 4.1% | 4.2% |
Similar Demographics by 1 or more Vehicles in Household
Demographics Similar to Cherokee by 1 or more Vehicles in Household
In terms of 1 or more vehicles in household, the demographic groups most similar to Cherokee are Basque (92.4%, a difference of 0.010%), Samoan (92.4%, a difference of 0.050%), Native Hawaiian (92.4%, a difference of 0.060%), Finnish (92.4%, a difference of 0.060%), and Sri Lankan (92.5%, a difference of 0.070%).
| Demographics | Rating | Rank | 1 or more Vehicles in Household |
| British | 100.0 /100 | #26 | Exceptional 92.5% |
| Americans | 100.0 /100 | #27 | Exceptional 92.5% |
| Sri Lankans | 100.0 /100 | #28 | Exceptional 92.5% |
| Native Hawaiians | 100.0 /100 | #29 | Exceptional 92.4% |
| Finns | 100.0 /100 | #30 | Exceptional 92.4% |
| Samoans | 100.0 /100 | #31 | Exceptional 92.4% |
| Basques | 100.0 /100 | #32 | Exceptional 92.4% |
| Cherokee | 100.0 /100 | #33 | Exceptional 92.4% |
| Italians | 99.9 /100 | #34 | Exceptional 92.3% |
| Czechoslovakians | 99.9 /100 | #35 | Exceptional 92.3% |
| Malaysians | 99.9 /100 | #36 | Exceptional 92.3% |
| French Canadians | 99.9 /100 | #37 | Exceptional 92.3% |
| Immigrants | Vietnam | 99.9 /100 | #38 | Exceptional 92.3% |
| Swiss | 99.9 /100 | #39 | Exceptional 92.3% |
| Creek | 99.9 /100 | #40 | Exceptional 92.3% |
Demographics Similar to Seminole by 1 or more Vehicles in Household
In terms of 1 or more vehicles in household, the demographic groups most similar to Seminole are Yugoslavian (91.1%, a difference of 0.010%), Bulgarian (91.1%, a difference of 0.020%), Asian (91.1%, a difference of 0.020%), Immigrants from Central America (91.1%, a difference of 0.030%), and Immigrants from Bolivia (91.2%, a difference of 0.070%).
| Demographics | Rating | Rank | 1 or more Vehicles in Household |
| Austrians | 99.0 /100 | #95 | Exceptional 91.3% |
| Potawatomi | 99.0 /100 | #96 | Exceptional 91.3% |
| Pakistanis | 99.0 /100 | #97 | Exceptional 91.3% |
| Slavs | 98.7 /100 | #98 | Exceptional 91.2% |
| Immigrants | Bolivia | 98.6 /100 | #99 | Exceptional 91.2% |
| Immigrants | Central America | 98.4 /100 | #100 | Exceptional 91.1% |
| Bulgarians | 98.4 /100 | #101 | Exceptional 91.1% |
| Seminole | 98.3 /100 | #102 | Exceptional 91.1% |
| Yugoslavians | 98.3 /100 | #103 | Exceptional 91.1% |
| Asians | 98.2 /100 | #104 | Exceptional 91.1% |
| Laotians | 98.0 /100 | #105 | Exceptional 91.0% |
| Zimbabweans | 97.7 /100 | #106 | Exceptional 91.0% |
| Maltese | 97.7 /100 | #107 | Exceptional 91.0% |
| Hispanics or Latinos | 97.6 /100 | #108 | Exceptional 91.0% |
| Delaware | 97.6 /100 | #109 | Exceptional 91.0% |