Zip Codes with the Highest Percentage of Population Employed in Health Diagnosing & Treating in Hampton, VA
RELATED REPORTS & OPTIONS
Health Diagnosing & Treating
Hampton
Compare Zip Codes
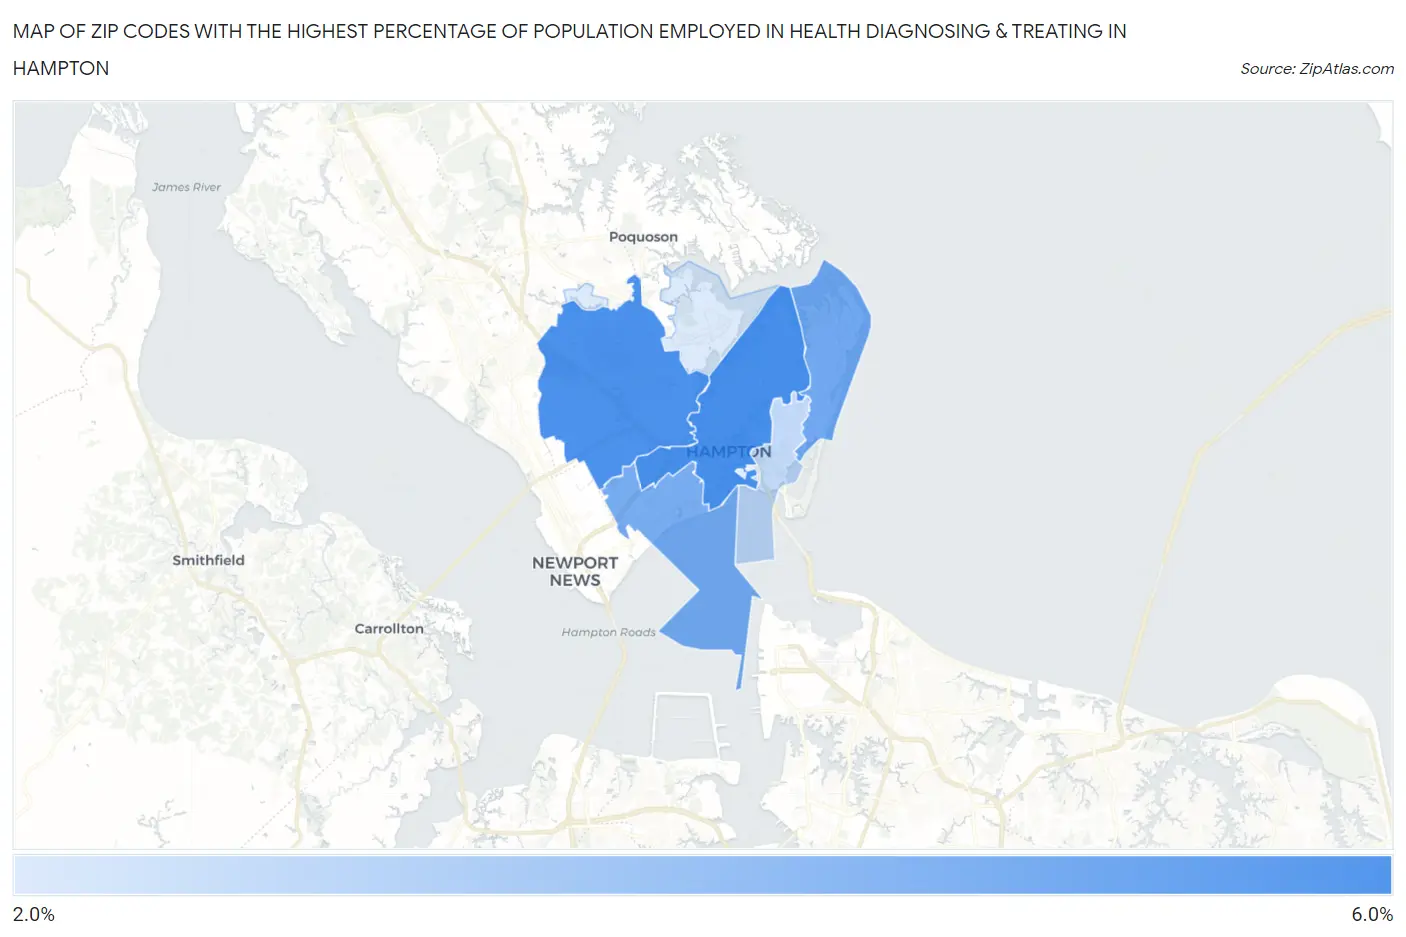
Map of Zip Codes with the Highest Percentage of Population Employed in Health Diagnosing & Treating in Hampton
2.1%
5.4%
Zip Codes with the Highest Percentage of Population Employed in Health Diagnosing & Treating in Hampton, VA
| Zip Code | % Employed | vs State | vs National | |
| 1. | 23669 | 5.4% | 5.7%(-0.216)#375 | 6.2%(-0.803)#16,009 |
| 2. | 23666 | 5.4% | 5.7%(-0.306)#384 | 6.2%(-0.894)#16,360 |
| 3. | 23664 | 4.5% | 5.7%(-1.17)#484 | 6.2%(-1.76)#19,689 |
| 4. | 23661 | 4.3% | 5.7%(-1.32)#499 | 6.2%(-1.91)#20,216 |
| 5. | 23663 | 2.7% | 5.7%(-2.97)#647 | 6.2%(-3.56)#25,091 |
| 6. | 23665 | 2.1% | 5.7%(-3.58)#680 | 6.2%(-4.17)#26,327 |
1
Common Questions
What are the Top 5 Zip Codes with the Highest Percentage of Population Employed in Health Diagnosing & Treating in Hampton, VA?
Top 5 Zip Codes with the Highest Percentage of Population Employed in Health Diagnosing & Treating in Hampton, VA are:
What zip code has the Highest Percentage of Population Employed in Health Diagnosing & Treating in Hampton, VA?
23669 has the Highest Percentage of Population Employed in Health Diagnosing & Treating in Hampton, VA with 5.4%.
What is the Percentage of Population Employed in Health Diagnosing & Treating in Hampton, VA?
Percentage of Population Employed in Health Diagnosing & Treating in Hampton is 5.0%.
What is the Percentage of Population Employed in Health Diagnosing & Treating in Virginia?
Percentage of Population Employed in Health Diagnosing & Treating in Virginia is 5.7%.
What is the Percentage of Population Employed in Health Diagnosing & Treating in the United States?
Percentage of Population Employed in Health Diagnosing & Treating in the United States is 6.2%.