Zip Codes with the Highest Percentage of Population Employed in Health Diagnosing & Treating in Centreville, VA
RELATED REPORTS & OPTIONS
Health Diagnosing & Treating
Centreville
Compare Zip Codes
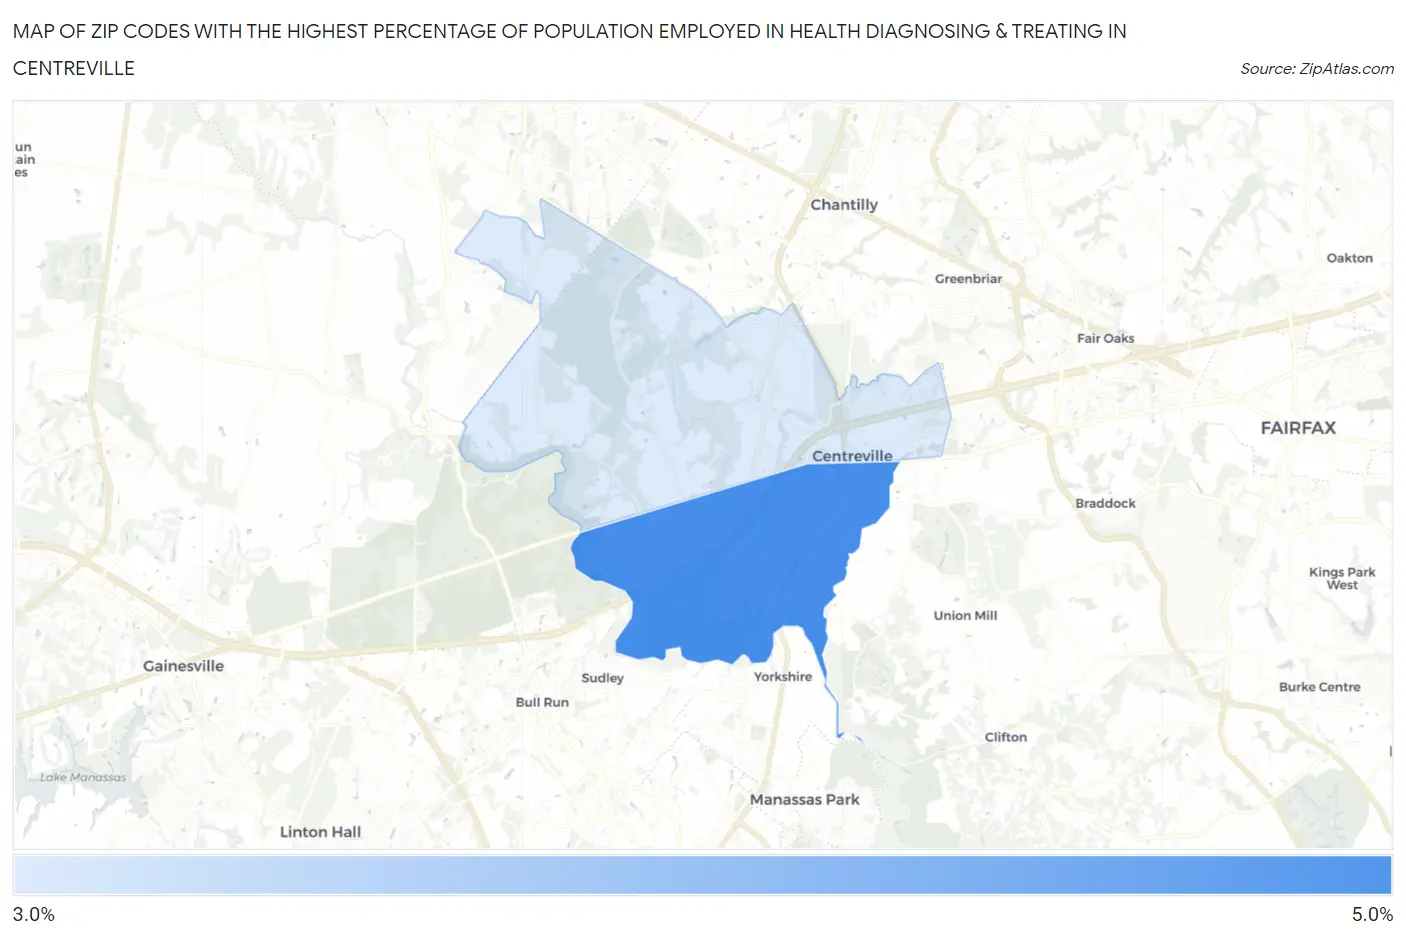
Map of Zip Codes with the Highest Percentage of Population Employed in Health Diagnosing & Treating in Centreville
4.0%
4.4%
Zip Codes with the Highest Percentage of Population Employed in Health Diagnosing & Treating in Centreville, VA
| Zip Code | % Employed | vs State | vs National | |
| 1. | 20121 | 4.4% | 5.7%(-1.30)#496 | 6.2%(-1.89)#20,132 |
| 2. | 20120 | 4.0% | 5.7%(-1.67)#538 | 6.2%(-2.26)#21,405 |
1
Common Questions
What are the Top Zip Codes with the Highest Percentage of Population Employed in Health Diagnosing & Treating in Centreville, VA?
Top Zip Codes with the Highest Percentage of Population Employed in Health Diagnosing & Treating in Centreville, VA are:
What zip code has the Highest Percentage of Population Employed in Health Diagnosing & Treating in Centreville, VA?
20121 has the Highest Percentage of Population Employed in Health Diagnosing & Treating in Centreville, VA with 4.4%.
What is the Percentage of Population Employed in Health Diagnosing & Treating in Centreville, VA?
Percentage of Population Employed in Health Diagnosing & Treating in Centreville is 4.0%.
What is the Percentage of Population Employed in Health Diagnosing & Treating in Virginia?
Percentage of Population Employed in Health Diagnosing & Treating in Virginia is 5.7%.
What is the Percentage of Population Employed in Health Diagnosing & Treating in the United States?
Percentage of Population Employed in Health Diagnosing & Treating in the United States is 6.2%.