Zip Codes with the Highest Percentage of Population Employed in Health Diagnosing & Treating in Reston, VA
RELATED REPORTS & OPTIONS
Health Diagnosing & Treating
Reston
Compare Zip Codes
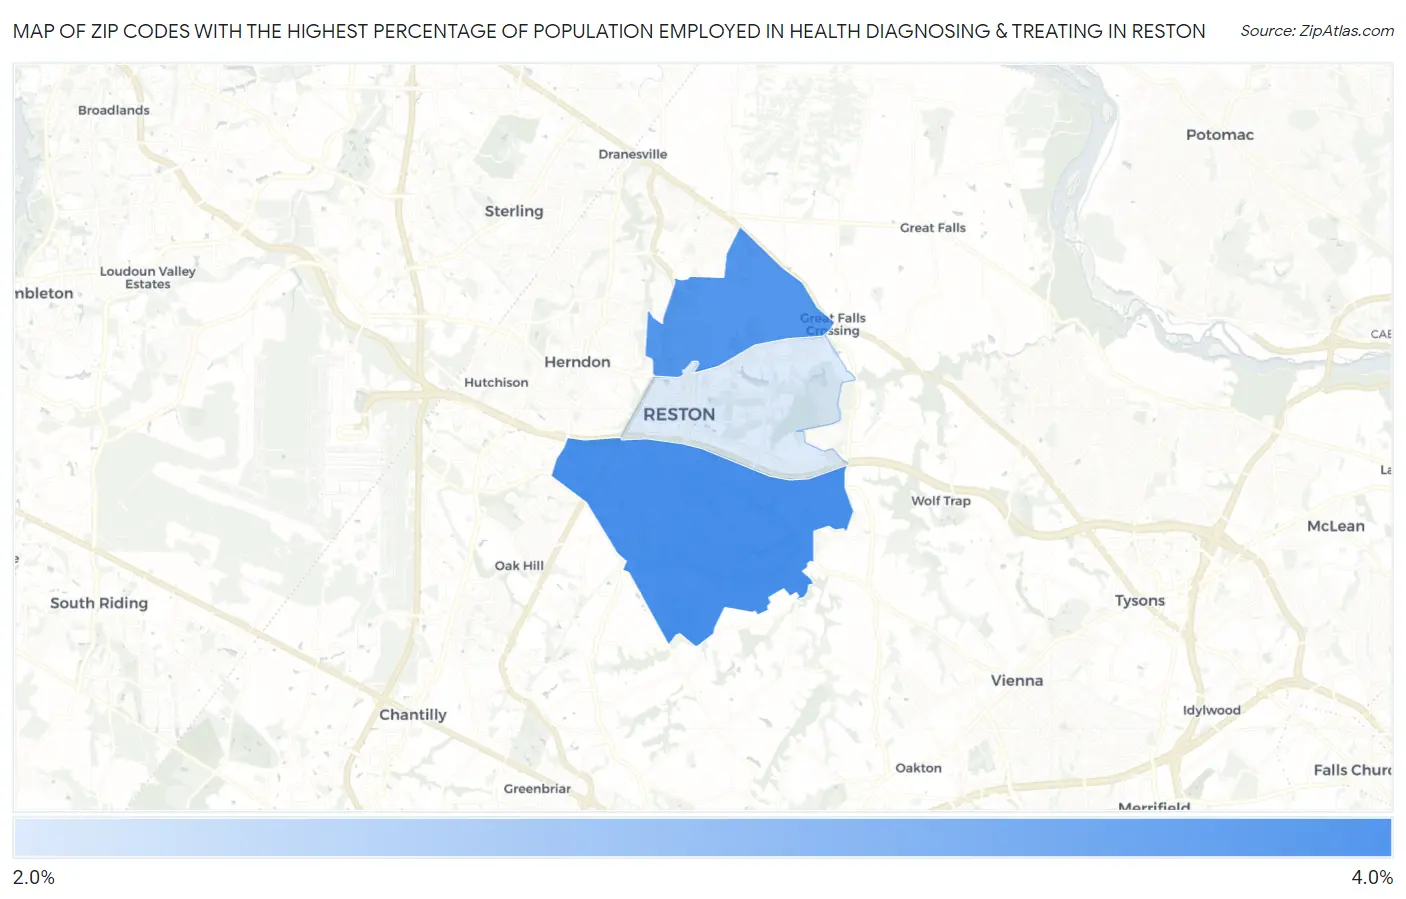
Map of Zip Codes with the Highest Percentage of Population Employed in Health Diagnosing & Treating in Reston
2.5%
3.5%
Zip Codes with the Highest Percentage of Population Employed in Health Diagnosing & Treating in Reston, VA
| Zip Code | % Employed | vs State | vs National | |
| 1. | 20191 | 3.5% | 5.7%(-2.12)#586 | 6.2%(-2.71)#22,806 |
| 2. | 20194 | 3.5% | 5.7%(-2.19)#589 | 6.2%(-2.78)#23,004 |
| 3. | 20190 | 2.5% | 5.7%(-3.11)#655 | 6.2%(-3.70)#25,412 |
1
Common Questions
What are the Top Zip Codes with the Highest Percentage of Population Employed in Health Diagnosing & Treating in Reston, VA?
Top Zip Codes with the Highest Percentage of Population Employed in Health Diagnosing & Treating in Reston, VA are:
What zip code has the Highest Percentage of Population Employed in Health Diagnosing & Treating in Reston, VA?
20191 has the Highest Percentage of Population Employed in Health Diagnosing & Treating in Reston, VA with 3.5%.
What is the Percentage of Population Employed in Health Diagnosing & Treating in Reston, VA?
Percentage of Population Employed in Health Diagnosing & Treating in Reston is 3.2%.
What is the Percentage of Population Employed in Health Diagnosing & Treating in Virginia?
Percentage of Population Employed in Health Diagnosing & Treating in Virginia is 5.7%.
What is the Percentage of Population Employed in Health Diagnosing & Treating in the United States?
Percentage of Population Employed in Health Diagnosing & Treating in the United States is 6.2%.