Zip Codes with the Highest Percentage of Population Employed in Health Diagnosing & Treating in Glen Allen, VA
RELATED REPORTS & OPTIONS
Health Diagnosing & Treating
Glen Allen
Compare Zip Codes
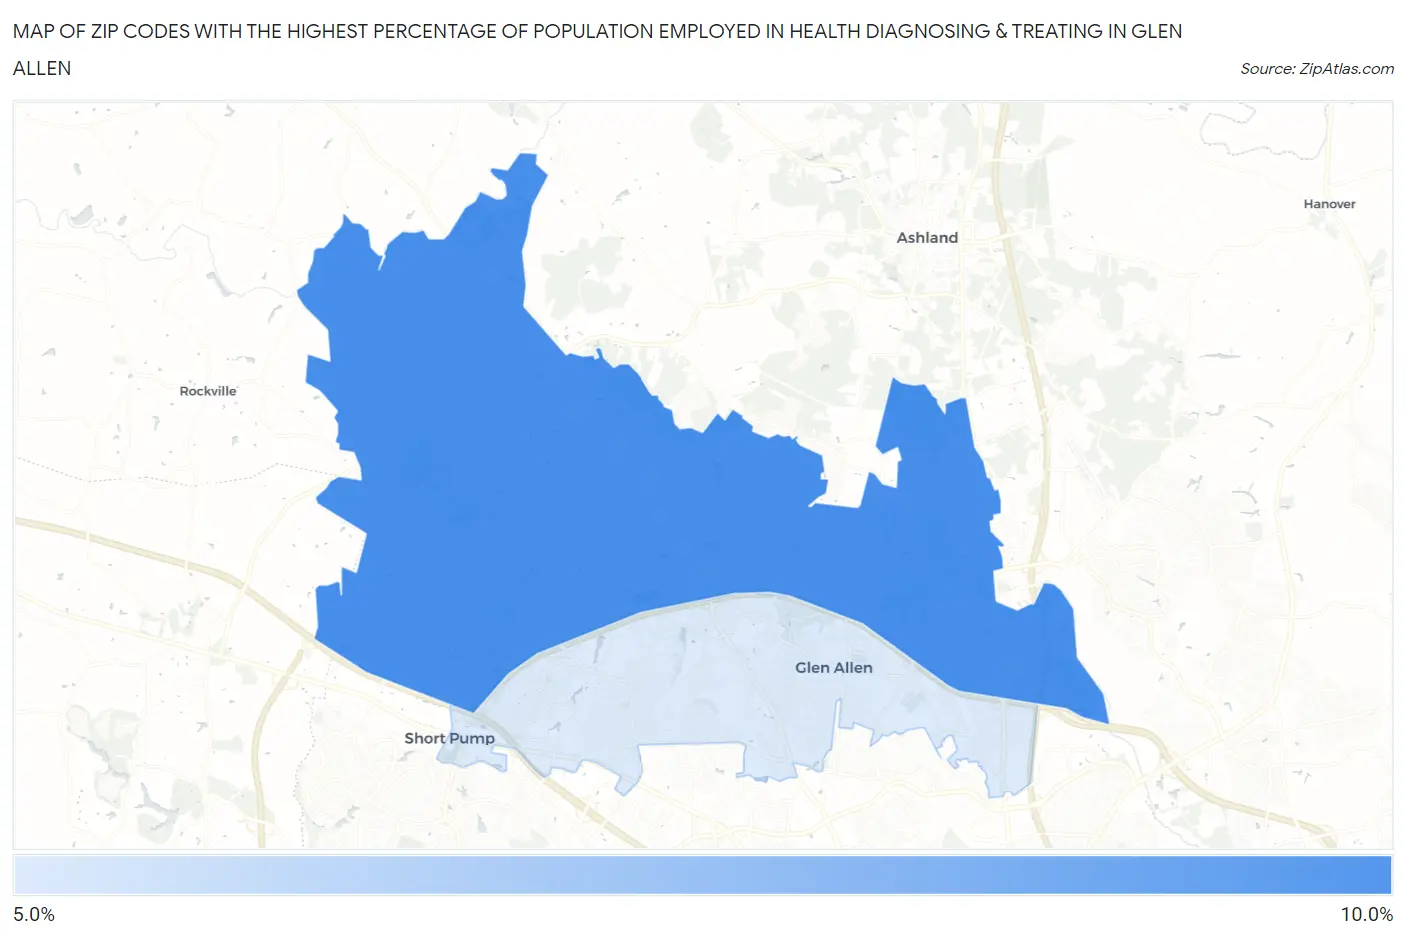
Map of Zip Codes with the Highest Percentage of Population Employed in Health Diagnosing & Treating in Glen Allen
5.3%
8.9%
Zip Codes with the Highest Percentage of Population Employed in Health Diagnosing & Treating in Glen Allen, VA
| Zip Code | % Employed | vs State | vs National | |
| 1. | 23059 | 8.9% | 5.7%(+3.29)#145 | 6.2%(+2.70)#5,451 |
| 2. | 23060 | 5.3% | 5.7%(-0.337)#389 | 6.2%(-0.925)#16,477 |
1
Common Questions
What are the Top Zip Codes with the Highest Percentage of Population Employed in Health Diagnosing & Treating in Glen Allen, VA?
Top Zip Codes with the Highest Percentage of Population Employed in Health Diagnosing & Treating in Glen Allen, VA are:
What zip code has the Highest Percentage of Population Employed in Health Diagnosing & Treating in Glen Allen, VA?
23059 has the Highest Percentage of Population Employed in Health Diagnosing & Treating in Glen Allen, VA with 8.9%.
What is the Percentage of Population Employed in Health Diagnosing & Treating in Glen Allen, VA?
Percentage of Population Employed in Health Diagnosing & Treating in Glen Allen is 3.1%.
What is the Percentage of Population Employed in Health Diagnosing & Treating in Virginia?
Percentage of Population Employed in Health Diagnosing & Treating in Virginia is 5.7%.
What is the Percentage of Population Employed in Health Diagnosing & Treating in the United States?
Percentage of Population Employed in Health Diagnosing & Treating in the United States is 6.2%.