Zimbabwean vs Malaysian Unemployment Among Ages 16 to 19 years
COMPARE
Zimbabwean
Malaysian
Unemployment Among Ages 16 to 19 years
Unemployment Among Ages 16 to 19 years Comparison
Zimbabweans
Malaysians
15.4%
UNEMPLOYMENT AMONG AGES 16 TO 19 YEARS
100.0/ 100
METRIC RATING
10th/ 347
METRIC RANK
17.0%
UNEMPLOYMENT AMONG AGES 16 TO 19 YEARS
94.2/ 100
METRIC RATING
108th/ 347
METRIC RANK
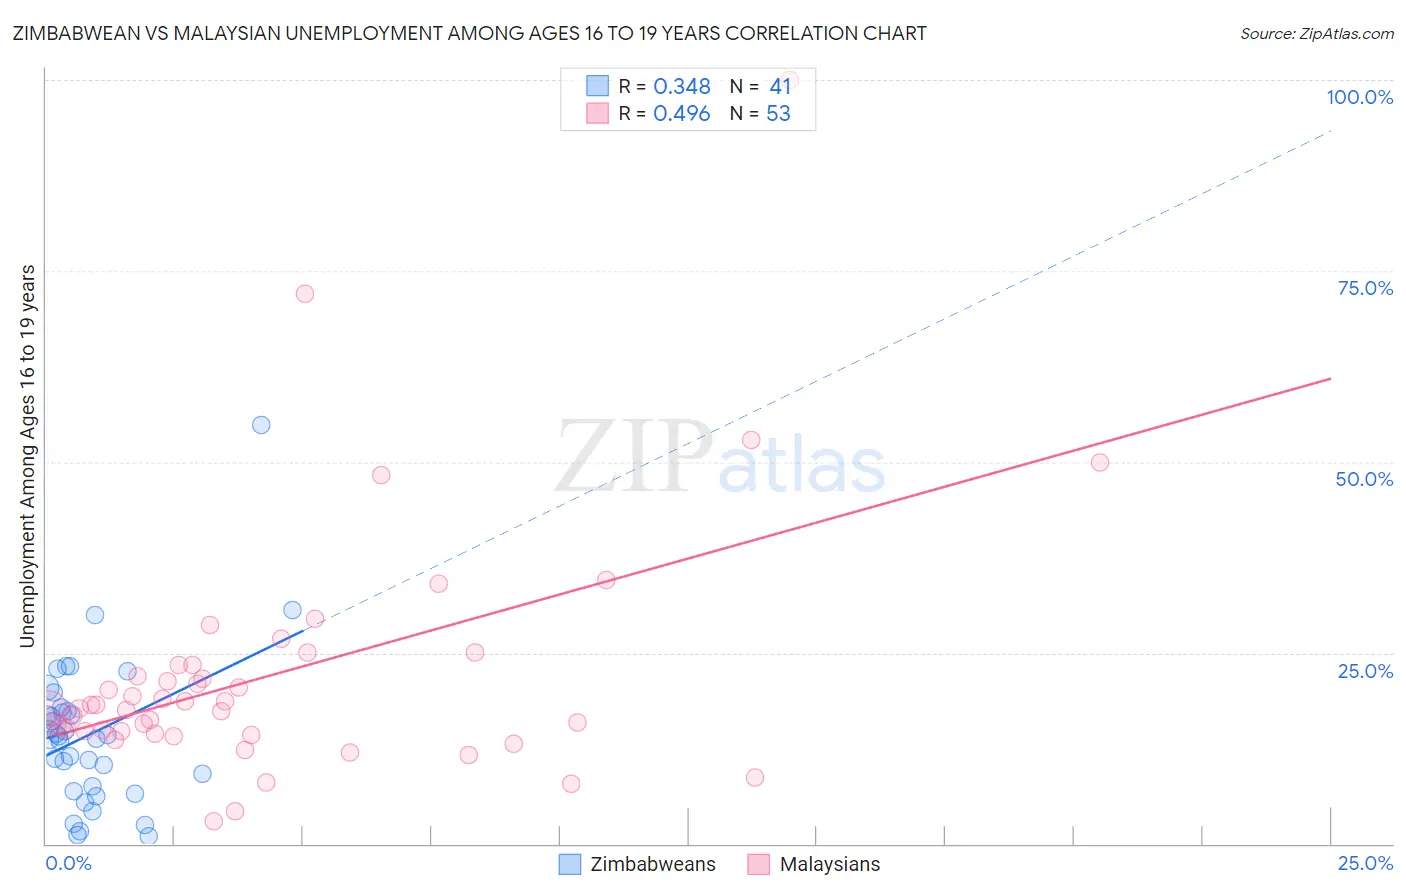
Zimbabwean vs Malaysian Unemployment Among Ages 16 to 19 years Correlation Chart
The statistical analysis conducted on geographies consisting of 68,440,311 people shows a mild positive correlation between the proportion of Zimbabweans and unemployment rate among population between the ages 16 and 19 in the United States with a correlation coefficient (R) of 0.348 and weighted average of 15.4%. Similarly, the statistical analysis conducted on geographies consisting of 220,414,743 people shows a moderate positive correlation between the proportion of Malaysians and unemployment rate among population between the ages 16 and 19 in the United States with a correlation coefficient (R) of 0.496 and weighted average of 17.0%, a difference of 10.0%.
Unemployment Among Ages 16 to 19 years Correlation Summary
| Measurement | Zimbabwean | Malaysian |
| Minimum | 1.0% | 2.9% |
| Maximum | 54.9% | 100.0% |
| Range | 53.9% | 97.1% |
| Mean | 14.4% | 22.2% |
| Median | 14.0% | 17.7% |
| Interquartile 25% (IQ1) | 7.2% | 14.6% |
| Interquartile 75% (IQ3) | 17.6% | 23.4% |
| Interquartile Range (IQR) | 10.4% | 8.8% |
| Standard Deviation (Sample) | 9.8% | 16.4% |
| Standard Deviation (Population) | 9.7% | 16.2% |
Similar Demographics by Unemployment Among Ages 16 to 19 years
Demographics Similar to Zimbabweans by Unemployment Among Ages 16 to 19 years
In terms of unemployment among ages 16 to 19 years, the demographic groups most similar to Zimbabweans are Scandinavian (15.4%, a difference of 0.11%), Indonesian (15.5%, a difference of 0.42%), Czech (15.4%, a difference of 0.44%), Taiwanese (15.5%, a difference of 0.52%), and Immigrants from Bosnia and Herzegovina (15.3%, a difference of 0.68%).
| Demographics | Rating | Rank | Unemployment Among Ages 16 to 19 years |
| Luxembourgers | 100.0 /100 | #3 | Exceptional 15.1% |
| Danes | 100.0 /100 | #4 | Exceptional 15.2% |
| Immigrants | Somalia | 100.0 /100 | #5 | Exceptional 15.3% |
| Swedes | 100.0 /100 | #6 | Exceptional 15.3% |
| Immigrants | Bosnia and Herzegovina | 100.0 /100 | #7 | Exceptional 15.3% |
| Czechs | 100.0 /100 | #8 | Exceptional 15.4% |
| Scandinavians | 100.0 /100 | #9 | Exceptional 15.4% |
| Zimbabweans | 100.0 /100 | #10 | Exceptional 15.4% |
| Indonesians | 100.0 /100 | #11 | Exceptional 15.5% |
| Taiwanese | 100.0 /100 | #12 | Exceptional 15.5% |
| Immigrants | Burma/Myanmar | 100.0 /100 | #13 | Exceptional 15.6% |
| Immigrants | Zaire | 100.0 /100 | #14 | Exceptional 15.6% |
| Yugoslavians | 100.0 /100 | #15 | Exceptional 15.6% |
| Germans | 100.0 /100 | #16 | Exceptional 15.7% |
| Somalis | 100.0 /100 | #17 | Exceptional 15.7% |
Demographics Similar to Malaysians by Unemployment Among Ages 16 to 19 years
In terms of unemployment among ages 16 to 19 years, the demographic groups most similar to Malaysians are Immigrants from Brazil (17.0%, a difference of 0.0%), Iranian (17.0%, a difference of 0.020%), Immigrants from Bulgaria (17.0%, a difference of 0.030%), Estonian (17.0%, a difference of 0.030%), and Immigrants from Netherlands (17.0%, a difference of 0.050%).
| Demographics | Rating | Rank | Unemployment Among Ages 16 to 19 years |
| Immigrants | Saudi Arabia | 94.7 /100 | #101 | Exceptional 17.0% |
| Immigrants | Pakistan | 94.6 /100 | #102 | Exceptional 17.0% |
| Palestinians | 94.6 /100 | #103 | Exceptional 17.0% |
| Italians | 94.5 /100 | #104 | Exceptional 17.0% |
| Immigrants | Bulgaria | 94.3 /100 | #105 | Exceptional 17.0% |
| Estonians | 94.3 /100 | #106 | Exceptional 17.0% |
| Immigrants | Brazil | 94.2 /100 | #107 | Exceptional 17.0% |
| Malaysians | 94.2 /100 | #108 | Exceptional 17.0% |
| Iranians | 94.1 /100 | #109 | Exceptional 17.0% |
| Immigrants | Netherlands | 93.9 /100 | #110 | Exceptional 17.0% |
| Immigrants | Asia | 93.9 /100 | #111 | Exceptional 17.0% |
| Immigrants | Iraq | 93.7 /100 | #112 | Exceptional 17.0% |
| Icelanders | 93.4 /100 | #113 | Exceptional 17.0% |
| Immigrants | Poland | 93.1 /100 | #114 | Exceptional 17.0% |
| Brazilians | 92.3 /100 | #115 | Exceptional 17.1% |