Zimbabwean vs Immigrants from Zimbabwe Unemployment Among Ages 55 to 59 years
COMPARE
Zimbabwean
Immigrants from Zimbabwe
Unemployment Among Ages 55 to 59 years
Unemployment Among Ages 55 to 59 years Comparison
Zimbabweans
Immigrants from Zimbabwe
4.2%
UNEMPLOYMENT AMONG AGES 55 TO 59 YEARS
100.0/ 100
METRIC RATING
7th/ 347
METRIC RANK
4.5%
UNEMPLOYMENT AMONG AGES 55 TO 59 YEARS
99.9/ 100
METRIC RATING
27th/ 347
METRIC RANK
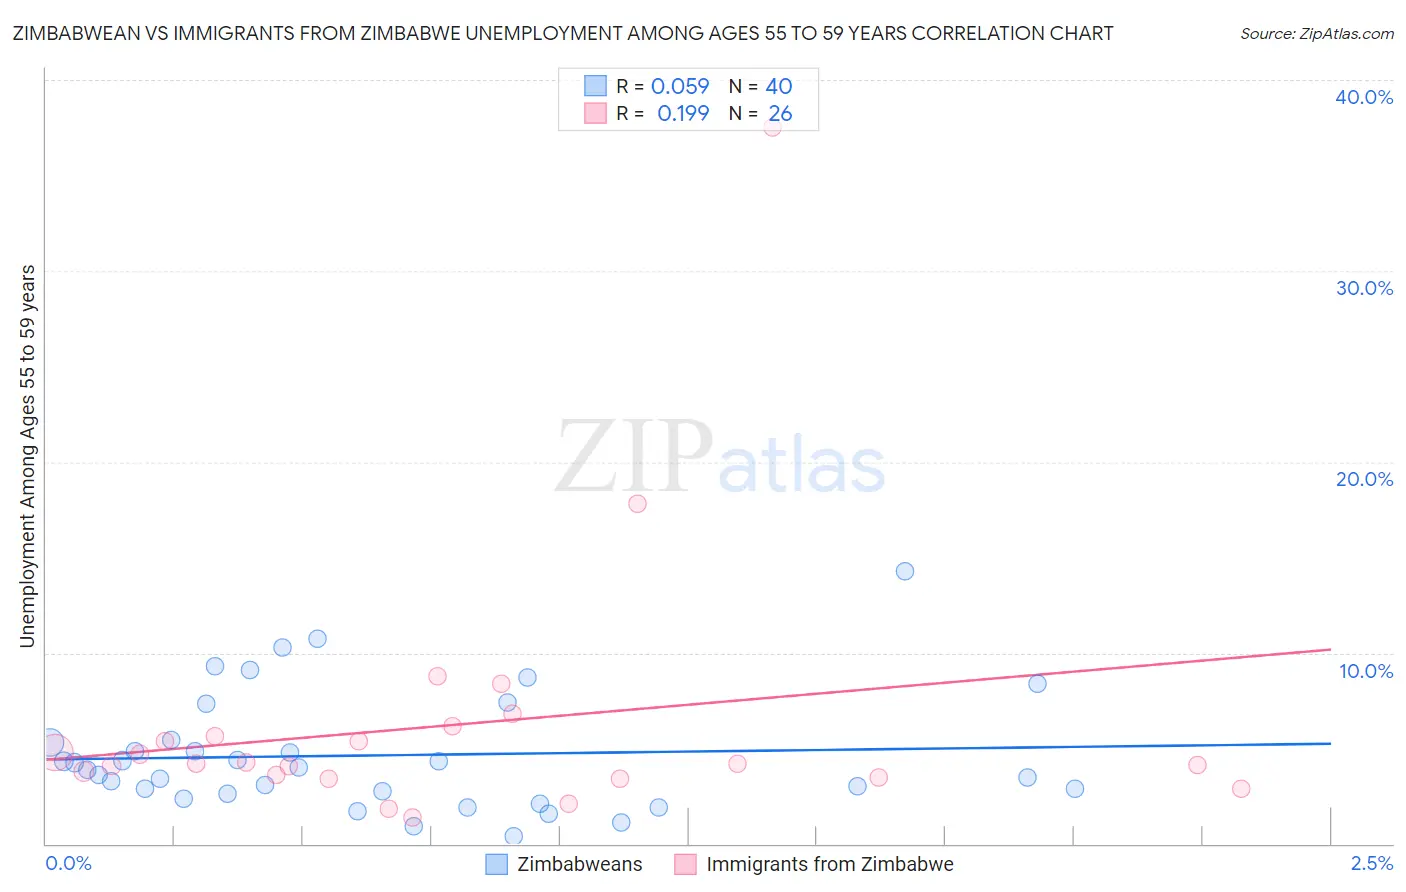
Zimbabwean vs Immigrants from Zimbabwe Unemployment Among Ages 55 to 59 years Correlation Chart
The statistical analysis conducted on geographies consisting of 68,276,409 people shows a slight positive correlation between the proportion of Zimbabweans and unemployment rate among population between the ages 55 and 59 in the United States with a correlation coefficient (R) of 0.059 and weighted average of 4.2%. Similarly, the statistical analysis conducted on geographies consisting of 115,273,379 people shows a poor positive correlation between the proportion of Immigrants from Zimbabwe and unemployment rate among population between the ages 55 and 59 in the United States with a correlation coefficient (R) of 0.199 and weighted average of 4.5%, a difference of 5.2%.
Unemployment Among Ages 55 to 59 years Correlation Summary
| Measurement | Zimbabwean | Immigrants from Zimbabwe |
| Minimum | 0.40% | 1.4% |
| Maximum | 14.3% | 37.5% |
| Range | 13.9% | 36.1% |
| Mean | 4.6% | 6.2% |
| Median | 3.9% | 4.2% |
| Interquartile 25% (IQ1) | 2.7% | 3.5% |
| Interquartile 75% (IQ3) | 5.4% | 5.6% |
| Interquartile Range (IQR) | 2.7% | 2.1% |
| Standard Deviation (Sample) | 3.1% | 7.1% |
| Standard Deviation (Population) | 3.0% | 7.0% |
Demographics Similar to Zimbabweans and Immigrants from Zimbabwe by Unemployment Among Ages 55 to 59 years
In terms of unemployment among ages 55 to 59 years, the demographic groups most similar to Zimbabweans are Bolivian (4.2%, a difference of 0.12%), Cuban (4.2%, a difference of 0.23%), Tongan (4.3%, a difference of 1.2%), Immigrants from Congo (4.3%, a difference of 1.7%), and Danish (4.3%, a difference of 1.9%). Similarly, the demographic groups most similar to Immigrants from Zimbabwe are Scandinavian (4.5%, a difference of 0.010%), Immigrants from Eritrea (4.4%, a difference of 0.18%), Jordanian (4.4%, a difference of 0.19%), Kenyan (4.4%, a difference of 0.48%), and Immigrants from Burma/Myanmar (4.4%, a difference of 0.73%).
| Demographics | Rating | Rank | Unemployment Among Ages 55 to 59 years |
| Zimbabweans | 100.0 /100 | #7 | Exceptional 4.2% |
| Bolivians | 100.0 /100 | #8 | Exceptional 4.2% |
| Cubans | 100.0 /100 | #9 | Exceptional 4.2% |
| Tongans | 100.0 /100 | #10 | Exceptional 4.3% |
| Immigrants | Congo | 100.0 /100 | #11 | Exceptional 4.3% |
| Danes | 100.0 /100 | #12 | Exceptional 4.3% |
| Indonesians | 100.0 /100 | #13 | Exceptional 4.3% |
| Immigrants | India | 100.0 /100 | #14 | Exceptional 4.3% |
| Bulgarians | 100.0 /100 | #15 | Exceptional 4.3% |
| Somalis | 100.0 /100 | #16 | Exceptional 4.4% |
| Czechs | 100.0 /100 | #17 | Exceptional 4.4% |
| Immigrants | Somalia | 100.0 /100 | #18 | Exceptional 4.4% |
| Chinese | 100.0 /100 | #19 | Exceptional 4.4% |
| Swedes | 100.0 /100 | #20 | Exceptional 4.4% |
| Puget Sound Salish | 100.0 /100 | #21 | Exceptional 4.4% |
| Immigrants | Burma/Myanmar | 100.0 /100 | #22 | Exceptional 4.4% |
| Kenyans | 100.0 /100 | #23 | Exceptional 4.4% |
| Jordanians | 100.0 /100 | #24 | Exceptional 4.4% |
| Immigrants | Eritrea | 100.0 /100 | #25 | Exceptional 4.4% |
| Scandinavians | 99.9 /100 | #26 | Exceptional 4.5% |
| Immigrants | Zimbabwe | 99.9 /100 | #27 | Exceptional 4.5% |