Zimbabwean vs German Unemployment Among Youth under 25 years
COMPARE
Zimbabwean
German
Unemployment Among Youth under 25 years
Unemployment Among Youth under 25 years Comparison
Zimbabweans
Germans
10.2%
UNEMPLOYMENT AMONG YOUTH UNDER 25 YEARS
100.0/ 100
METRIC RATING
4th/ 347
METRIC RANK
10.5%
UNEMPLOYMENT AMONG YOUTH UNDER 25 YEARS
100.0/ 100
METRIC RATING
9th/ 347
METRIC RANK
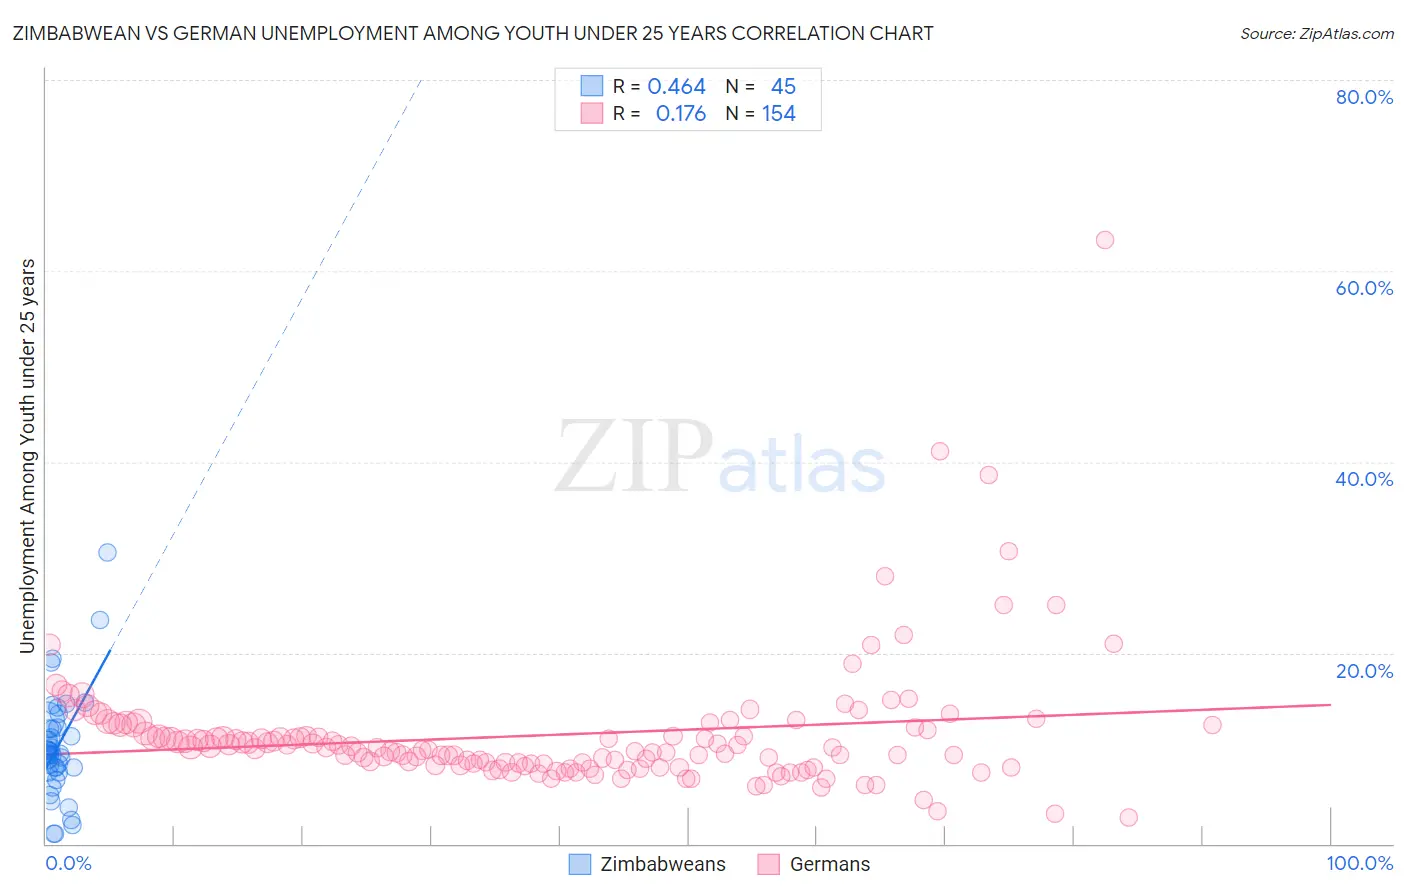
Zimbabwean vs German Unemployment Among Youth under 25 years Correlation Chart
The statistical analysis conducted on geographies consisting of 69,135,830 people shows a moderate positive correlation between the proportion of Zimbabweans and unemployment rate among youth under the age of 25 in the United States with a correlation coefficient (R) of 0.464 and weighted average of 10.2%. Similarly, the statistical analysis conducted on geographies consisting of 552,720,168 people shows a poor positive correlation between the proportion of Germans and unemployment rate among youth under the age of 25 in the United States with a correlation coefficient (R) of 0.176 and weighted average of 10.5%, a difference of 3.2%.
Unemployment Among Youth under 25 years Correlation Summary
| Measurement | Zimbabwean | German |
| Minimum | 1.0% | 2.8% |
| Maximum | 30.5% | 63.2% |
| Range | 29.5% | 60.4% |
| Mean | 10.2% | 11.4% |
| Median | 9.5% | 10.1% |
| Interquartile 25% (IQ1) | 7.7% | 8.2% |
| Interquartile 75% (IQ3) | 12.1% | 11.9% |
| Interquartile Range (IQR) | 4.4% | 3.6% |
| Standard Deviation (Sample) | 5.5% | 6.8% |
| Standard Deviation (Population) | 5.4% | 6.7% |
Demographics Similar to Zimbabweans and Germans by Unemployment Among Youth under 25 years
In terms of unemployment among youth under 25 years, the demographic groups most similar to Zimbabweans are Czech (10.3%, a difference of 1.1%), Danish (10.3%, a difference of 1.2%), Luxembourger (10.0%, a difference of 1.6%), Immigrants from Cuba (10.0%, a difference of 1.9%), and Swedish (10.4%, a difference of 2.0%). Similarly, the demographic groups most similar to Germans are Immigrants from Somalia (10.5%, a difference of 0.020%), Scandinavian (10.5%, a difference of 0.15%), Immigrants from Sudan (10.5%, a difference of 0.33%), Immigrants from Venezuela (10.5%, a difference of 0.40%), and Indonesian (10.6%, a difference of 0.45%).
| Demographics | Rating | Rank | Unemployment Among Youth under 25 years |
| Norwegians | 100.0 /100 | #1 | Exceptional 9.8% |
| Immigrants | Cuba | 100.0 /100 | #2 | Exceptional 10.0% |
| Luxembourgers | 100.0 /100 | #3 | Exceptional 10.0% |
| Zimbabweans | 100.0 /100 | #4 | Exceptional 10.2% |
| Czechs | 100.0 /100 | #5 | Exceptional 10.3% |
| Danes | 100.0 /100 | #6 | Exceptional 10.3% |
| Swedes | 100.0 /100 | #7 | Exceptional 10.4% |
| Immigrants | Venezuela | 100.0 /100 | #8 | Exceptional 10.5% |
| Germans | 100.0 /100 | #9 | Exceptional 10.5% |
| Immigrants | Somalia | 100.0 /100 | #10 | Exceptional 10.5% |
| Scandinavians | 100.0 /100 | #11 | Exceptional 10.5% |
| Immigrants | Sudan | 100.0 /100 | #12 | Exceptional 10.5% |
| Indonesians | 100.0 /100 | #13 | Exceptional 10.6% |
| Cubans | 100.0 /100 | #14 | Exceptional 10.6% |
| Sudanese | 100.0 /100 | #15 | Exceptional 10.6% |
| Venezuelans | 100.0 /100 | #16 | Exceptional 10.6% |
| Menominee | 100.0 /100 | #17 | Exceptional 10.6% |
| Swiss | 100.0 /100 | #18 | Exceptional 10.6% |
| Immigrants | Burma/Myanmar | 100.0 /100 | #19 | Exceptional 10.6% |
| Dutch | 100.0 /100 | #20 | Exceptional 10.6% |