Yuman vs Immigrants from Morocco Unemployment Among Seniors over 65 years
COMPARE
Yuman
Immigrants from Morocco
Unemployment Among Seniors over 65 years
Unemployment Among Seniors over 65 years Comparison
Yuman
Immigrants from Morocco
5.8%
UNEMPLOYMENT AMONG SENIORS OVER 65 YEARS
0.0/ 100
METRIC RATING
324th/ 347
METRIC RANK
5.4%
UNEMPLOYMENT AMONG SENIORS OVER 65 YEARS
0.1/ 100
METRIC RATING
270th/ 347
METRIC RANK
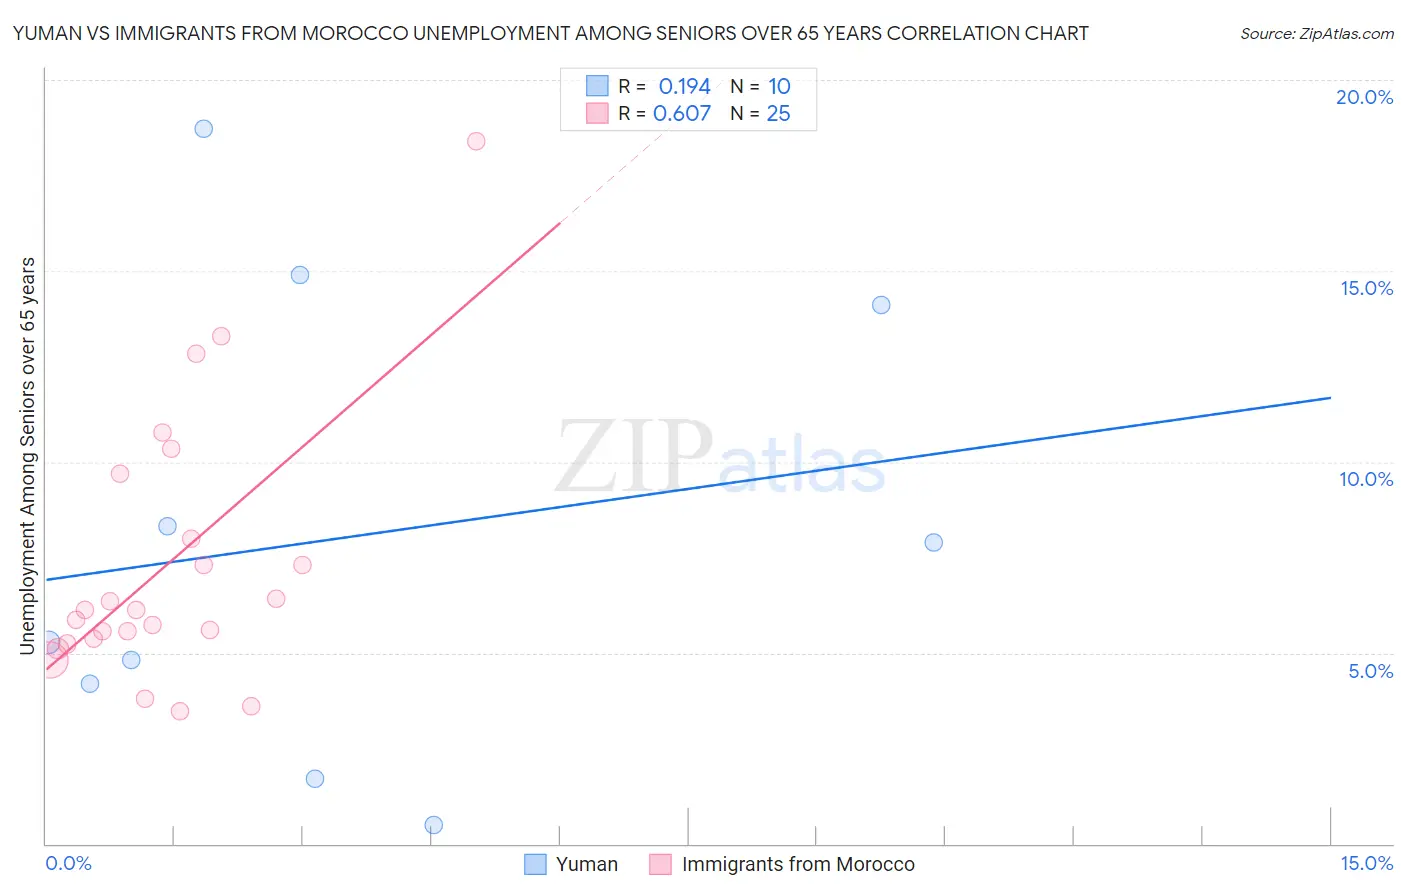
Yuman vs Immigrants from Morocco Unemployment Among Seniors over 65 years Correlation Chart
The statistical analysis conducted on geographies consisting of 39,235,005 people shows a poor positive correlation between the proportion of Yuman and unemployment rate amomg seniors over the age of 65 in the United States with a correlation coefficient (R) of 0.194 and weighted average of 5.8%. Similarly, the statistical analysis conducted on geographies consisting of 171,708,146 people shows a significant positive correlation between the proportion of Immigrants from Morocco and unemployment rate amomg seniors over the age of 65 in the United States with a correlation coefficient (R) of 0.607 and weighted average of 5.4%, a difference of 6.9%.
Unemployment Among Seniors over 65 years Correlation Summary
| Measurement | Yuman | Immigrants from Morocco |
| Minimum | 0.50% | 3.5% |
| Maximum | 18.7% | 18.4% |
| Range | 18.2% | 14.9% |
| Mean | 8.0% | 7.3% |
| Median | 6.6% | 6.1% |
| Interquartile 25% (IQ1) | 4.2% | 5.3% |
| Interquartile 75% (IQ3) | 14.1% | 8.8% |
| Interquartile Range (IQR) | 9.9% | 3.5% |
| Standard Deviation (Sample) | 6.0% | 3.5% |
| Standard Deviation (Population) | 5.7% | 3.4% |
Similar Demographics by Unemployment Among Seniors over 65 years
Demographics Similar to Yuman by Unemployment Among Seniors over 65 years
In terms of unemployment among seniors over 65 years, the demographic groups most similar to Yuman are Immigrants from Dominica (5.8%, a difference of 0.18%), Native/Alaskan (5.8%, a difference of 0.51%), Inupiat (5.8%, a difference of 0.57%), British West Indian (5.8%, a difference of 0.59%), and Shoshone (5.9%, a difference of 1.0%).
| Demographics | Rating | Rank | Unemployment Among Seniors over 65 years |
| Immigrants | Bahamas | 0.0 /100 | #317 | Tragic 5.7% |
| Vietnamese | 0.0 /100 | #318 | Tragic 5.7% |
| Immigrants | Bangladesh | 0.0 /100 | #319 | Tragic 5.7% |
| Immigrants | Mexico | 0.0 /100 | #320 | Tragic 5.7% |
| British West Indians | 0.0 /100 | #321 | Tragic 5.8% |
| Natives/Alaskans | 0.0 /100 | #322 | Tragic 5.8% |
| Immigrants | Dominica | 0.0 /100 | #323 | Tragic 5.8% |
| Yuman | 0.0 /100 | #324 | Tragic 5.8% |
| Inupiat | 0.0 /100 | #325 | Tragic 5.8% |
| Shoshone | 0.0 /100 | #326 | Tragic 5.9% |
| Bermudans | 0.0 /100 | #327 | Tragic 5.9% |
| Puerto Ricans | 0.0 /100 | #328 | Tragic 5.9% |
| Dominicans | 0.0 /100 | #329 | Tragic 6.0% |
| Immigrants | Portugal | 0.0 /100 | #330 | Tragic 6.0% |
| Taiwanese | 0.0 /100 | #331 | Tragic 6.0% |
Demographics Similar to Immigrants from Morocco by Unemployment Among Seniors over 65 years
In terms of unemployment among seniors over 65 years, the demographic groups most similar to Immigrants from Morocco are Cypriot (5.4%, a difference of 0.010%), Immigrants from Jamaica (5.4%, a difference of 0.010%), Immigrants from Nigeria (5.4%, a difference of 0.030%), Immigrants from Southern Europe (5.4%, a difference of 0.070%), and Immigrants from Brazil (5.4%, a difference of 0.070%).
| Demographics | Rating | Rank | Unemployment Among Seniors over 65 years |
| South Americans | 0.2 /100 | #263 | Tragic 5.4% |
| Central American Indians | 0.2 /100 | #264 | Tragic 5.4% |
| Immigrants | Colombia | 0.2 /100 | #265 | Tragic 5.4% |
| Pennsylvania Germans | 0.2 /100 | #266 | Tragic 5.4% |
| Chippewa | 0.2 /100 | #267 | Tragic 5.4% |
| Hawaiians | 0.1 /100 | #268 | Tragic 5.4% |
| Immigrants | Southern Europe | 0.1 /100 | #269 | Tragic 5.4% |
| Immigrants | Morocco | 0.1 /100 | #270 | Tragic 5.4% |
| Cypriots | 0.1 /100 | #271 | Tragic 5.4% |
| Immigrants | Jamaica | 0.1 /100 | #272 | Tragic 5.4% |
| Immigrants | Nigeria | 0.1 /100 | #273 | Tragic 5.4% |
| Immigrants | Brazil | 0.1 /100 | #274 | Tragic 5.4% |
| Mexican American Indians | 0.1 /100 | #275 | Tragic 5.4% |
| Pueblo | 0.1 /100 | #276 | Tragic 5.4% |
| Immigrants | Western Africa | 0.1 /100 | #277 | Tragic 5.4% |