Yuman vs Immigrants from Kazakhstan Unemployment Among Ages 65 to 74 years
COMPARE
Yuman
Immigrants from Kazakhstan
Unemployment Among Ages 65 to 74 years
Unemployment Among Ages 65 to 74 years Comparison
Yuman
Immigrants from Kazakhstan
6.2%
UNEMPLOYMENT AMONG AGES 65 TO 74 YEARS
0.0/ 100
METRIC RATING
329th/ 347
METRIC RANK
5.1%
UNEMPLOYMENT AMONG AGES 65 TO 74 YEARS
99.7/ 100
METRIC RATING
51st/ 347
METRIC RANK
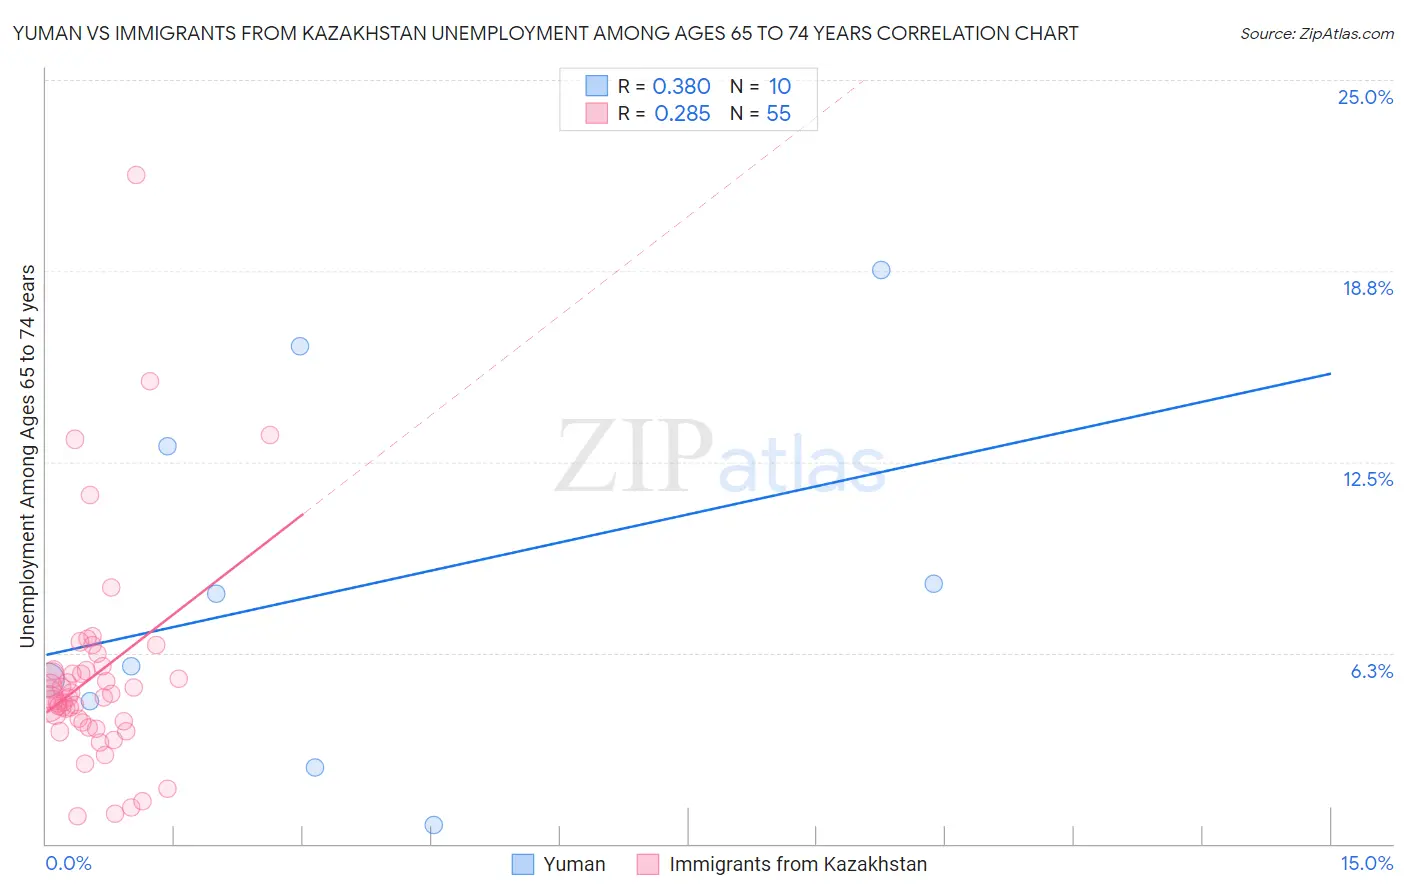
Yuman vs Immigrants from Kazakhstan Unemployment Among Ages 65 to 74 years Correlation Chart
The statistical analysis conducted on geographies consisting of 39,013,883 people shows a mild positive correlation between the proportion of Yuman and unemployment rate among population between the ages 65 and 74 in the United States with a correlation coefficient (R) of 0.380 and weighted average of 6.2%. Similarly, the statistical analysis conducted on geographies consisting of 118,784,088 people shows a weak positive correlation between the proportion of Immigrants from Kazakhstan and unemployment rate among population between the ages 65 and 74 in the United States with a correlation coefficient (R) of 0.285 and weighted average of 5.1%, a difference of 22.3%.
Unemployment Among Ages 65 to 74 years Correlation Summary
| Measurement | Yuman | Immigrants from Kazakhstan |
| Minimum | 0.60% | 0.90% |
| Maximum | 18.8% | 21.9% |
| Range | 18.2% | 21.0% |
| Mean | 8.4% | 5.5% |
| Median | 7.0% | 4.8% |
| Interquartile 25% (IQ1) | 4.7% | 4.0% |
| Interquartile 75% (IQ3) | 13.0% | 5.7% |
| Interquartile Range (IQR) | 8.3% | 1.7% |
| Standard Deviation (Sample) | 5.9% | 3.6% |
| Standard Deviation (Population) | 5.6% | 3.5% |
Similar Demographics by Unemployment Among Ages 65 to 74 years
Demographics Similar to Yuman by Unemployment Among Ages 65 to 74 years
In terms of unemployment among ages 65 to 74 years, the demographic groups most similar to Yuman are Dominican (6.3%, a difference of 0.30%), Immigrants from the Azores (6.2%, a difference of 0.35%), Bermudan (6.3%, a difference of 0.45%), Shoshone (6.2%, a difference of 0.52%), and Immigrants from Dominican Republic (6.3%, a difference of 0.77%).
| Demographics | Rating | Rank | Unemployment Among Ages 65 to 74 years |
| Immigrants | Mexico | 0.0 /100 | #322 | Tragic 6.0% |
| Delaware | 0.0 /100 | #323 | Tragic 6.0% |
| Tohono O'odham | 0.0 /100 | #324 | Tragic 6.0% |
| Immigrants | Portugal | 0.0 /100 | #325 | Tragic 6.0% |
| Natives/Alaskans | 0.0 /100 | #326 | Tragic 6.0% |
| Shoshone | 0.0 /100 | #327 | Tragic 6.2% |
| Immigrants | Azores | 0.0 /100 | #328 | Tragic 6.2% |
| Yuman | 0.0 /100 | #329 | Tragic 6.2% |
| Dominicans | 0.0 /100 | #330 | Tragic 6.3% |
| Bermudans | 0.0 /100 | #331 | Tragic 6.3% |
| Immigrants | Dominican Republic | 0.0 /100 | #332 | Tragic 6.3% |
| Paiute | 0.0 /100 | #333 | Tragic 6.3% |
| Taiwanese | 0.0 /100 | #334 | Tragic 6.3% |
| Puerto Ricans | 0.0 /100 | #335 | Tragic 6.4% |
| Immigrants | Armenia | 0.0 /100 | #336 | Tragic 6.5% |
Demographics Similar to Immigrants from Kazakhstan by Unemployment Among Ages 65 to 74 years
In terms of unemployment among ages 65 to 74 years, the demographic groups most similar to Immigrants from Kazakhstan are Immigrants from Zimbabwe (5.1%, a difference of 0.020%), Immigrants from Austria (5.1%, a difference of 0.19%), Choctaw (5.1%, a difference of 0.20%), European (5.1%, a difference of 0.26%), and Immigrants from Ethiopia (5.1%, a difference of 0.27%).
| Demographics | Rating | Rank | Unemployment Among Ages 65 to 74 years |
| Immigrants | India | 99.9 /100 | #44 | Exceptional 5.1% |
| Sioux | 99.8 /100 | #45 | Exceptional 5.1% |
| Immigrants | Kenya | 99.8 /100 | #46 | Exceptional 5.1% |
| Immigrants | Uganda | 99.8 /100 | #47 | Exceptional 5.1% |
| Choctaw | 99.8 /100 | #48 | Exceptional 5.1% |
| Immigrants | Austria | 99.8 /100 | #49 | Exceptional 5.1% |
| Immigrants | Zimbabwe | 99.7 /100 | #50 | Exceptional 5.1% |
| Immigrants | Kazakhstan | 99.7 /100 | #51 | Exceptional 5.1% |
| Europeans | 99.6 /100 | #52 | Exceptional 5.1% |
| Immigrants | Ethiopia | 99.6 /100 | #53 | Exceptional 5.1% |
| Immigrants | Nicaragua | 99.6 /100 | #54 | Exceptional 5.1% |
| Carpatho Rusyns | 99.6 /100 | #55 | Exceptional 5.1% |
| Swedes | 99.5 /100 | #56 | Exceptional 5.1% |
| Croatians | 99.5 /100 | #57 | Exceptional 5.1% |
| Germans | 99.5 /100 | #58 | Exceptional 5.1% |