Yugoslavian vs Immigrants from Serbia Unemployment Among Ages 20 to 24 years
COMPARE
Yugoslavian
Immigrants from Serbia
Unemployment Among Ages 20 to 24 years
Unemployment Among Ages 20 to 24 years Comparison
Yugoslavians
Immigrants from Serbia
9.6%
UNEMPLOYMENT AMONG AGES 20 TO 24 YEARS
100.0/ 100
METRIC RATING
34th/ 347
METRIC RANK
9.8%
UNEMPLOYMENT AMONG AGES 20 TO 24 YEARS
99.6/ 100
METRIC RATING
53rd/ 347
METRIC RANK
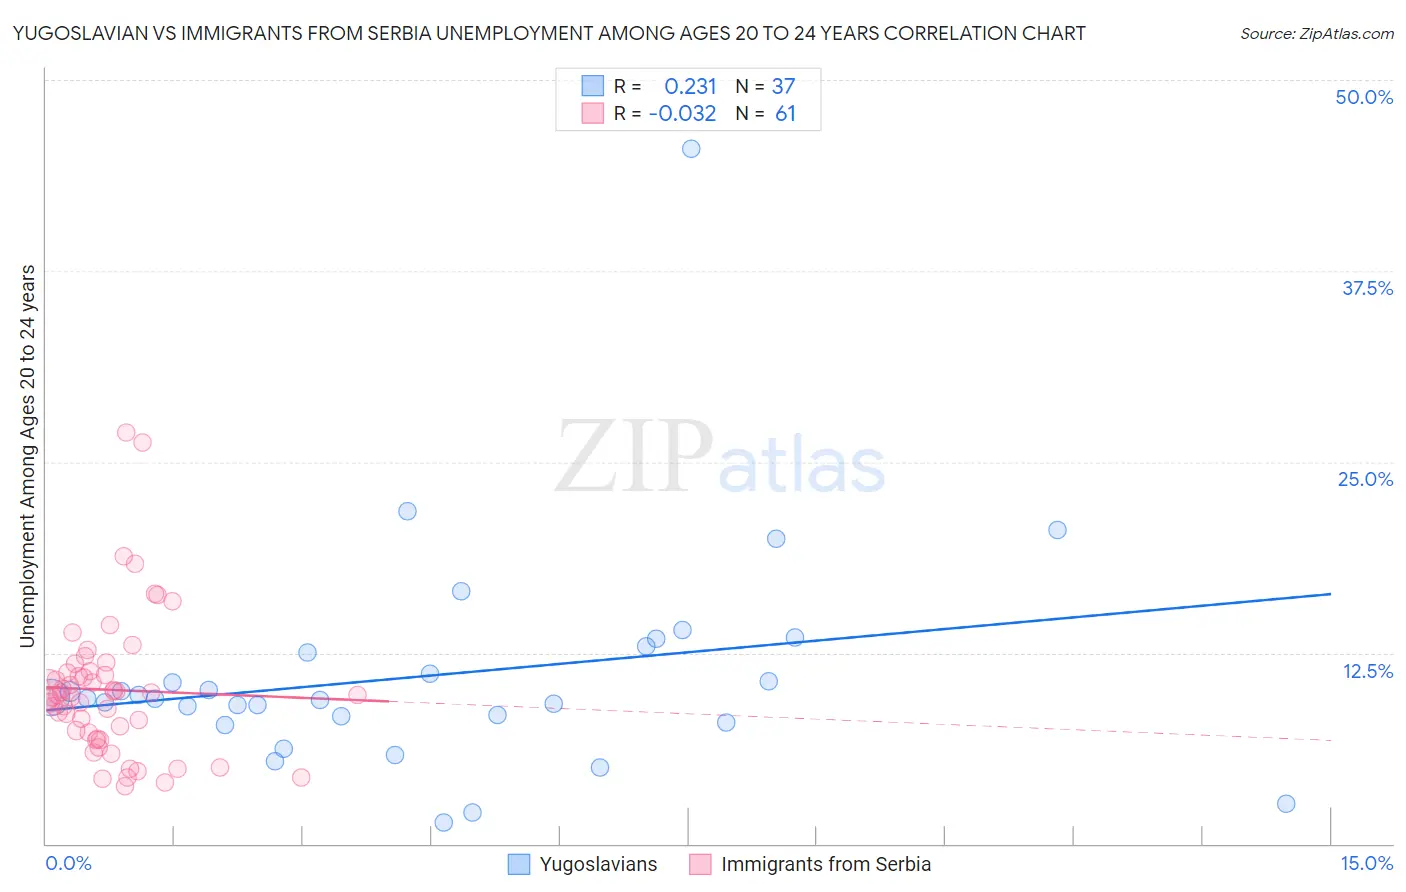
Yugoslavian vs Immigrants from Serbia Unemployment Among Ages 20 to 24 years Correlation Chart
The statistical analysis conducted on geographies consisting of 278,670,423 people shows a weak positive correlation between the proportion of Yugoslavians and unemployment rate among population between the ages 20 and 24 in the United States with a correlation coefficient (R) of 0.231 and weighted average of 9.6%. Similarly, the statistical analysis conducted on geographies consisting of 130,318,042 people shows no correlation between the proportion of Immigrants from Serbia and unemployment rate among population between the ages 20 and 24 in the United States with a correlation coefficient (R) of -0.032 and weighted average of 9.8%, a difference of 2.1%.
Unemployment Among Ages 20 to 24 years Correlation Summary
| Measurement | Yugoslavian | Immigrants from Serbia |
| Minimum | 1.4% | 3.8% |
| Maximum | 45.5% | 26.9% |
| Range | 44.1% | 23.1% |
| Mean | 11.0% | 10.1% |
| Median | 9.5% | 9.7% |
| Interquartile 25% (IQ1) | 8.1% | 7.1% |
| Interquartile 75% (IQ3) | 12.7% | 11.3% |
| Interquartile Range (IQR) | 4.6% | 4.2% |
| Standard Deviation (Sample) | 7.4% | 4.6% |
| Standard Deviation (Population) | 7.3% | 4.6% |
Demographics Similar to Yugoslavians and Immigrants from Serbia by Unemployment Among Ages 20 to 24 years
In terms of unemployment among ages 20 to 24 years, the demographic groups most similar to Yugoslavians are German (9.6%, a difference of 0.080%), Belgian (9.6%, a difference of 0.11%), Immigrants from Zaire (9.6%, a difference of 0.19%), Australian (9.6%, a difference of 0.20%), and Afghan (9.6%, a difference of 0.25%). Similarly, the demographic groups most similar to Immigrants from Serbia are Immigrants from Thailand (9.8%, a difference of 0.11%), Ethiopian (9.8%, a difference of 0.22%), Immigrants from Kenya (9.7%, a difference of 0.29%), Creek (9.7%, a difference of 0.43%), and Finnish (9.7%, a difference of 0.51%).
| Demographics | Rating | Rank | Unemployment Among Ages 20 to 24 years |
| Australians | 100.0 /100 | #33 | Exceptional 9.6% |
| Yugoslavians | 100.0 /100 | #34 | Exceptional 9.6% |
| Germans | 100.0 /100 | #35 | Exceptional 9.6% |
| Belgians | 100.0 /100 | #36 | Exceptional 9.6% |
| Immigrants | Zaire | 100.0 /100 | #37 | Exceptional 9.6% |
| Afghans | 99.9 /100 | #38 | Exceptional 9.6% |
| Dutch | 99.9 /100 | #39 | Exceptional 9.6% |
| Immigrants | Ethiopia | 99.9 /100 | #40 | Exceptional 9.6% |
| Swiss | 99.9 /100 | #41 | Exceptional 9.7% |
| Immigrants | Saudi Arabia | 99.9 /100 | #42 | Exceptional 9.7% |
| Menominee | 99.8 /100 | #43 | Exceptional 9.7% |
| Europeans | 99.8 /100 | #44 | Exceptional 9.7% |
| Croatians | 99.8 /100 | #45 | Exceptional 9.7% |
| Immigrants | Nicaragua | 99.8 /100 | #46 | Exceptional 9.7% |
| Immigrants | India | 99.8 /100 | #47 | Exceptional 9.7% |
| Finns | 99.8 /100 | #48 | Exceptional 9.7% |
| Creek | 99.8 /100 | #49 | Exceptional 9.7% |
| Immigrants | Kenya | 99.7 /100 | #50 | Exceptional 9.7% |
| Ethiopians | 99.7 /100 | #51 | Exceptional 9.8% |
| Immigrants | Thailand | 99.7 /100 | #52 | Exceptional 9.8% |
| Immigrants | Serbia | 99.6 /100 | #53 | Exceptional 9.8% |