Yugoslavian vs Immigrants from Northern Africa Unemployment Among Seniors over 75 years
COMPARE
Yugoslavian
Immigrants from Northern Africa
Unemployment Among Seniors over 75 years
Unemployment Among Seniors over 75 years Comparison
Yugoslavians
Immigrants from Northern Africa
9.1%
UNEMPLOYMENT AMONG SENIORS OVER 75 YEARS
4.8/ 100
METRIC RATING
233rd/ 347
METRIC RANK
8.2%
UNEMPLOYMENT AMONG SENIORS OVER 75 YEARS
99.3/ 100
METRIC RATING
98th/ 347
METRIC RANK
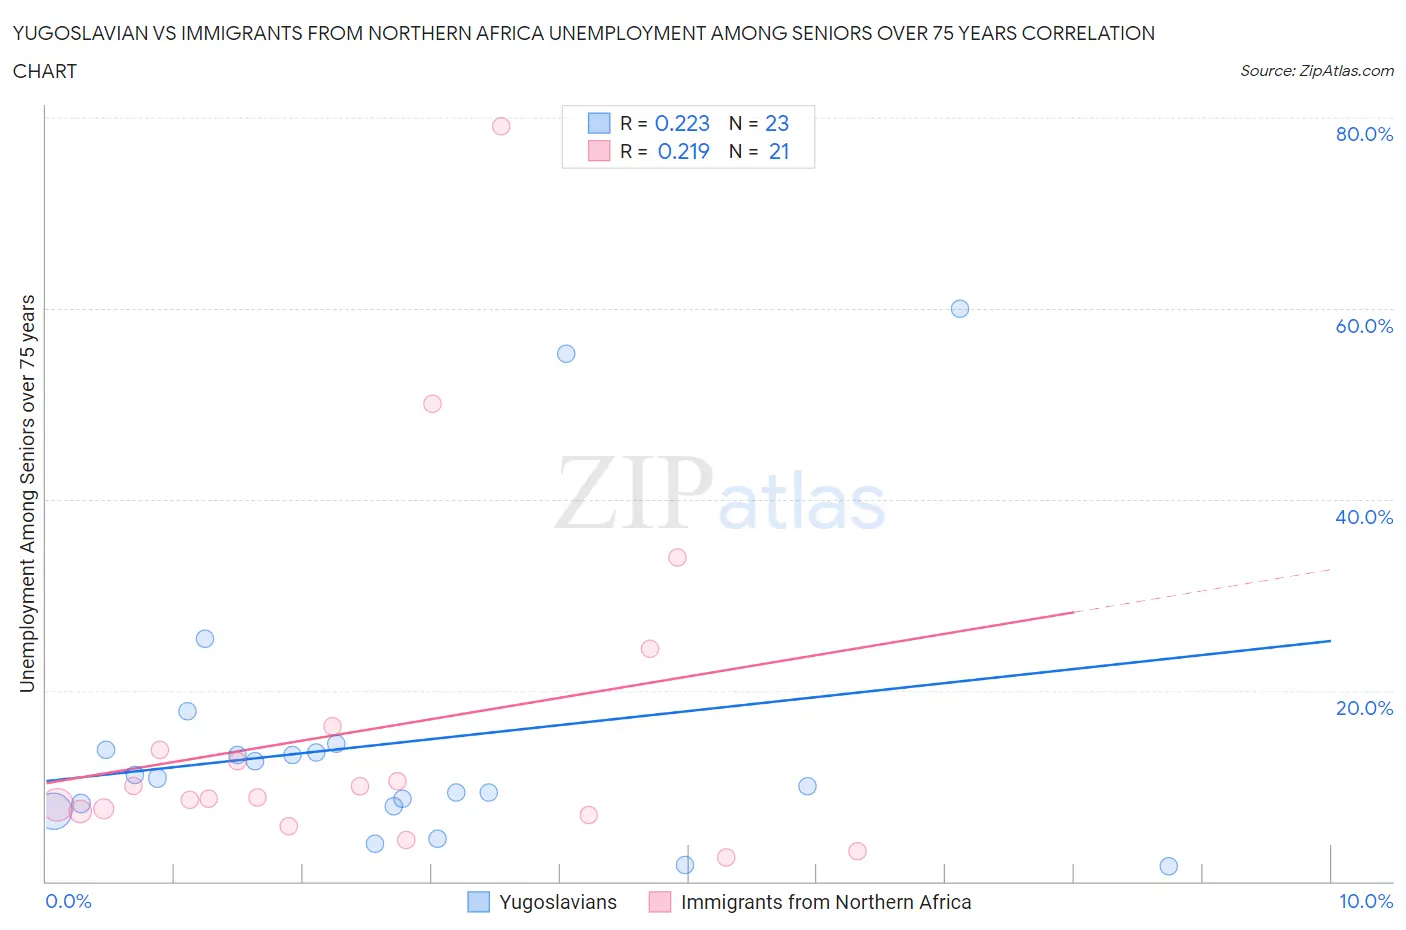
Yugoslavian vs Immigrants from Northern Africa Unemployment Among Seniors over 75 years Correlation Chart
The statistical analysis conducted on geographies consisting of 163,293,100 people shows a weak positive correlation between the proportion of Yugoslavians and unemployment rate among seniors over the age of 75 in the United States with a correlation coefficient (R) of 0.223 and weighted average of 9.1%. Similarly, the statistical analysis conducted on geographies consisting of 181,749,712 people shows a weak positive correlation between the proportion of Immigrants from Northern Africa and unemployment rate among seniors over the age of 75 in the United States with a correlation coefficient (R) of 0.219 and weighted average of 8.2%, a difference of 11.3%.
Unemployment Among Seniors over 75 years Correlation Summary
| Measurement | Yugoslavian | Immigrants from Northern Africa |
| Minimum | 1.6% | 2.5% |
| Maximum | 60.0% | 79.1% |
| Range | 58.4% | 76.6% |
| Mean | 14.5% | 15.8% |
| Median | 10.8% | 8.8% |
| Interquartile 25% (IQ1) | 7.8% | 7.1% |
| Interquartile 75% (IQ3) | 13.8% | 15.0% |
| Interquartile Range (IQR) | 5.9% | 7.9% |
| Standard Deviation (Sample) | 14.6% | 18.3% |
| Standard Deviation (Population) | 14.3% | 17.8% |
Similar Demographics by Unemployment Among Seniors over 75 years
Demographics Similar to Yugoslavians by Unemployment Among Seniors over 75 years
In terms of unemployment among seniors over 75 years, the demographic groups most similar to Yugoslavians are African (9.1%, a difference of 0.020%), Northern European (9.1%, a difference of 0.040%), Immigrants from Central America (9.1%, a difference of 0.040%), Hispanic or Latino (9.1%, a difference of 0.050%), and Vietnamese (9.1%, a difference of 0.050%).
| Demographics | Rating | Rank | Unemployment Among Seniors over 75 years |
| Immigrants | Bangladesh | 5.9 /100 | #226 | Tragic 9.1% |
| Samoans | 5.7 /100 | #227 | Tragic 9.1% |
| Kenyans | 5.4 /100 | #228 | Tragic 9.1% |
| Hispanics or Latinos | 5.0 /100 | #229 | Tragic 9.1% |
| Northern Europeans | 4.9 /100 | #230 | Tragic 9.1% |
| Immigrants | Central America | 4.9 /100 | #231 | Tragic 9.1% |
| Africans | 4.9 /100 | #232 | Tragic 9.1% |
| Yugoslavians | 4.8 /100 | #233 | Tragic 9.1% |
| Vietnamese | 4.6 /100 | #234 | Tragic 9.1% |
| Panamanians | 4.0 /100 | #235 | Tragic 9.1% |
| Jordanians | 4.0 /100 | #236 | Tragic 9.1% |
| Houma | 3.9 /100 | #237 | Tragic 9.1% |
| Inupiat | 3.6 /100 | #238 | Tragic 9.1% |
| Mexicans | 3.5 /100 | #239 | Tragic 9.1% |
| Spanish | 3.3 /100 | #240 | Tragic 9.1% |
Demographics Similar to Immigrants from Northern Africa by Unemployment Among Seniors over 75 years
In terms of unemployment among seniors over 75 years, the demographic groups most similar to Immigrants from Northern Africa are Immigrants from Sri Lanka (8.2%, a difference of 0.040%), Burmese (8.2%, a difference of 0.090%), Immigrants from Kazakhstan (8.2%, a difference of 0.10%), Immigrants from Belgium (8.2%, a difference of 0.12%), and Nicaraguan (8.2%, a difference of 0.14%).
| Demographics | Rating | Rank | Unemployment Among Seniors over 75 years |
| Egyptians | 99.5 /100 | #91 | Exceptional 8.1% |
| Venezuelans | 99.5 /100 | #92 | Exceptional 8.1% |
| Immigrants | Netherlands | 99.5 /100 | #93 | Exceptional 8.1% |
| Immigrants | Ireland | 99.4 /100 | #94 | Exceptional 8.1% |
| Nicaraguans | 99.3 /100 | #95 | Exceptional 8.2% |
| Immigrants | Belgium | 99.3 /100 | #96 | Exceptional 8.2% |
| Immigrants | Sri Lanka | 99.3 /100 | #97 | Exceptional 8.2% |
| Immigrants | Northern Africa | 99.3 /100 | #98 | Exceptional 8.2% |
| Burmese | 99.2 /100 | #99 | Exceptional 8.2% |
| Immigrants | Kazakhstan | 99.2 /100 | #100 | Exceptional 8.2% |
| Immigrants | Serbia | 99.2 /100 | #101 | Exceptional 8.2% |
| Immigrants | Panama | 99.1 /100 | #102 | Exceptional 8.2% |
| South American Indians | 99.1 /100 | #103 | Exceptional 8.2% |
| Immigrants | South Central Asia | 99.0 /100 | #104 | Exceptional 8.2% |
| Immigrants | Caribbean | 99.0 /100 | #105 | Exceptional 8.2% |