Yaqui vs Immigrants from Uruguay Unemployment Among Ages 16 to 19 years
COMPARE
Yaqui
Immigrants from Uruguay
Unemployment Among Ages 16 to 19 years
Unemployment Among Ages 16 to 19 years Comparison
Yaqui
Immigrants from Uruguay
19.0%
UNEMPLOYMENT AMONG AGES 16 TO 19 YEARS
0.1/ 100
METRIC RATING
264th/ 347
METRIC RANK
17.6%
UNEMPLOYMENT AMONG AGES 16 TO 19 YEARS
44.6/ 100
METRIC RATING
183rd/ 347
METRIC RANK
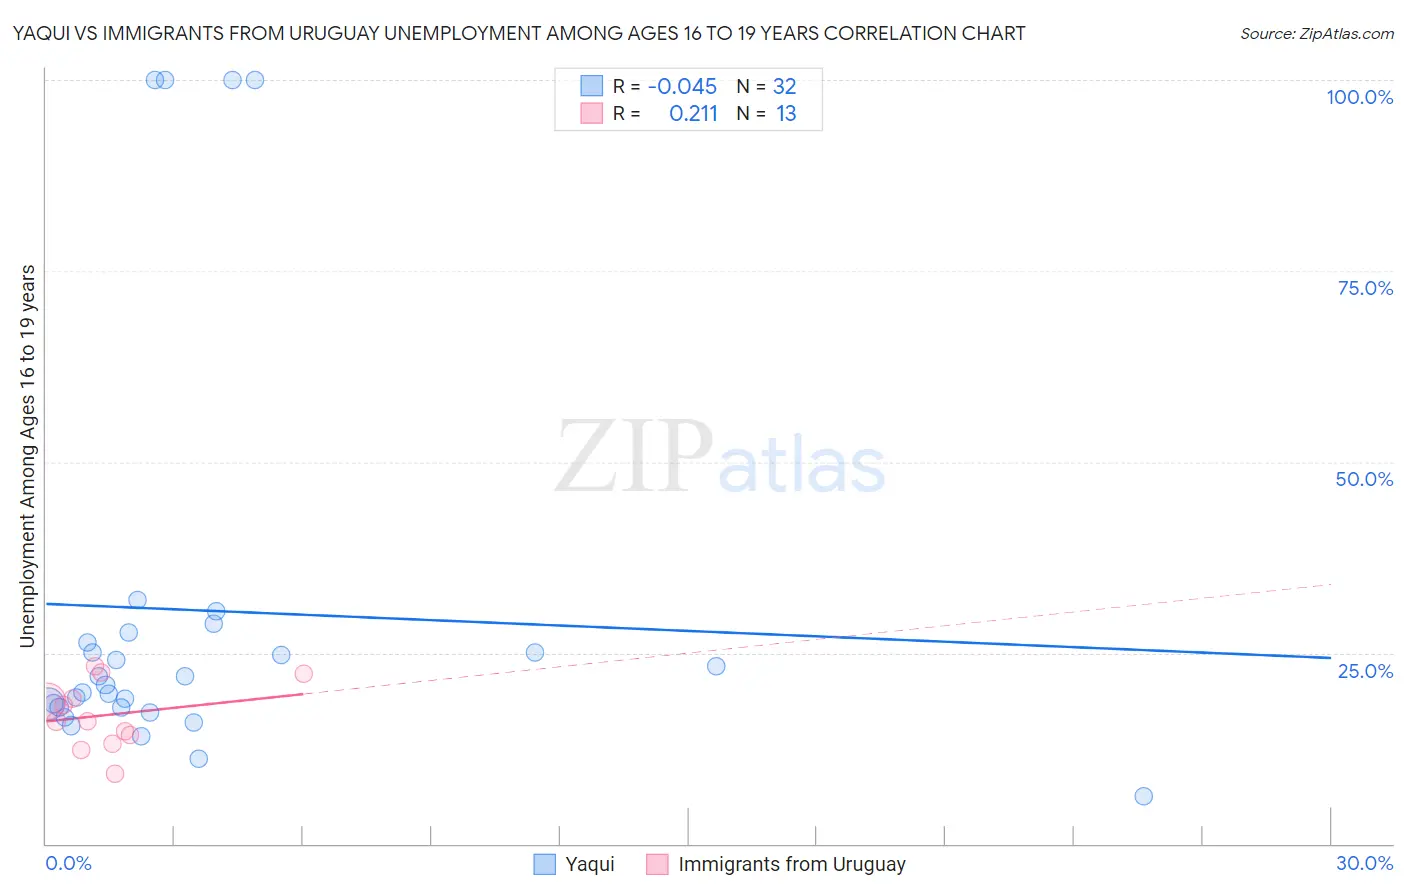
Yaqui vs Immigrants from Uruguay Unemployment Among Ages 16 to 19 years Correlation Chart
The statistical analysis conducted on geographies consisting of 105,605,513 people shows no correlation between the proportion of Yaqui and unemployment rate among population between the ages 16 and 19 in the United States with a correlation coefficient (R) of -0.045 and weighted average of 19.0%. Similarly, the statistical analysis conducted on geographies consisting of 130,443,609 people shows a weak positive correlation between the proportion of Immigrants from Uruguay and unemployment rate among population between the ages 16 and 19 in the United States with a correlation coefficient (R) of 0.211 and weighted average of 17.6%, a difference of 7.6%.
Unemployment Among Ages 16 to 19 years Correlation Summary
| Measurement | Yaqui | Immigrants from Uruguay |
| Minimum | 6.3% | 9.1% |
| Maximum | 100.0% | 23.2% |
| Range | 93.7% | 14.1% |
| Mean | 30.6% | 16.9% |
| Median | 21.3% | 16.1% |
| Interquartile 25% (IQ1) | 17.9% | 13.6% |
| Interquartile 75% (IQ3) | 27.0% | 20.6% |
| Interquartile Range (IQR) | 9.1% | 7.0% |
| Standard Deviation (Sample) | 27.2% | 4.3% |
| Standard Deviation (Population) | 26.8% | 4.1% |
Similar Demographics by Unemployment Among Ages 16 to 19 years
Demographics Similar to Yaqui by Unemployment Among Ages 16 to 19 years
In terms of unemployment among ages 16 to 19 years, the demographic groups most similar to Yaqui are Choctaw (19.0%, a difference of 0.010%), Cree (19.0%, a difference of 0.030%), Immigrants from Honduras (19.0%, a difference of 0.10%), Salvadoran (18.9%, a difference of 0.16%), and Spanish American Indian (18.9%, a difference of 0.20%).
| Demographics | Rating | Rank | Unemployment Among Ages 16 to 19 years |
| Immigrants | Nigeria | 0.2 /100 | #257 | Tragic 18.9% |
| Immigrants | Mexico | 0.2 /100 | #258 | Tragic 18.9% |
| Immigrants | Central America | 0.2 /100 | #259 | Tragic 18.9% |
| Nigerians | 0.2 /100 | #260 | Tragic 18.9% |
| Spanish American Indians | 0.1 /100 | #261 | Tragic 18.9% |
| Salvadorans | 0.1 /100 | #262 | Tragic 18.9% |
| Cree | 0.1 /100 | #263 | Tragic 19.0% |
| Yaqui | 0.1 /100 | #264 | Tragic 19.0% |
| Choctaw | 0.1 /100 | #265 | Tragic 19.0% |
| Immigrants | Honduras | 0.1 /100 | #266 | Tragic 19.0% |
| Israelis | 0.1 /100 | #267 | Tragic 19.0% |
| Immigrants | El Salvador | 0.1 /100 | #268 | Tragic 19.1% |
| Lumbee | 0.1 /100 | #269 | Tragic 19.1% |
| Hondurans | 0.1 /100 | #270 | Tragic 19.2% |
| Blackfeet | 0.0 /100 | #271 | Tragic 19.2% |
Demographics Similar to Immigrants from Uruguay by Unemployment Among Ages 16 to 19 years
In terms of unemployment among ages 16 to 19 years, the demographic groups most similar to Immigrants from Uruguay are Eastern European (17.6%, a difference of 0.020%), Russian (17.6%, a difference of 0.030%), Immigrants from Turkey (17.6%, a difference of 0.050%), Iroquois (17.6%, a difference of 0.050%), and Japanese (17.6%, a difference of 0.070%).
| Demographics | Rating | Rank | Unemployment Among Ages 16 to 19 years |
| Nicaraguans | 48.9 /100 | #176 | Average 17.6% |
| Bermudans | 48.7 /100 | #177 | Average 17.6% |
| Celtics | 48.7 /100 | #178 | Average 17.6% |
| Americans | 47.4 /100 | #179 | Average 17.6% |
| Spaniards | 47.1 /100 | #180 | Average 17.6% |
| Immigrants | Turkey | 45.6 /100 | #181 | Average 17.6% |
| Russians | 45.2 /100 | #182 | Average 17.6% |
| Immigrants | Uruguay | 44.6 /100 | #183 | Average 17.6% |
| Eastern Europeans | 44.3 /100 | #184 | Average 17.6% |
| Iroquois | 43.4 /100 | #185 | Average 17.6% |
| Japanese | 43.2 /100 | #186 | Average 17.6% |
| Immigrants | Micronesia | 42.4 /100 | #187 | Average 17.6% |
| Immigrants | Nicaragua | 42.2 /100 | #188 | Average 17.6% |
| Immigrants | Europe | 41.8 /100 | #189 | Average 17.6% |
| Marshallese | 41.7 /100 | #190 | Average 17.6% |